Dashboard - Subscriptions
This page provides details on the Subscriptions dashboard
The Subscriptions dashboard presents the evolution of different indicators based on the date the subscription started (original purchase date)
Number of Subscriptions
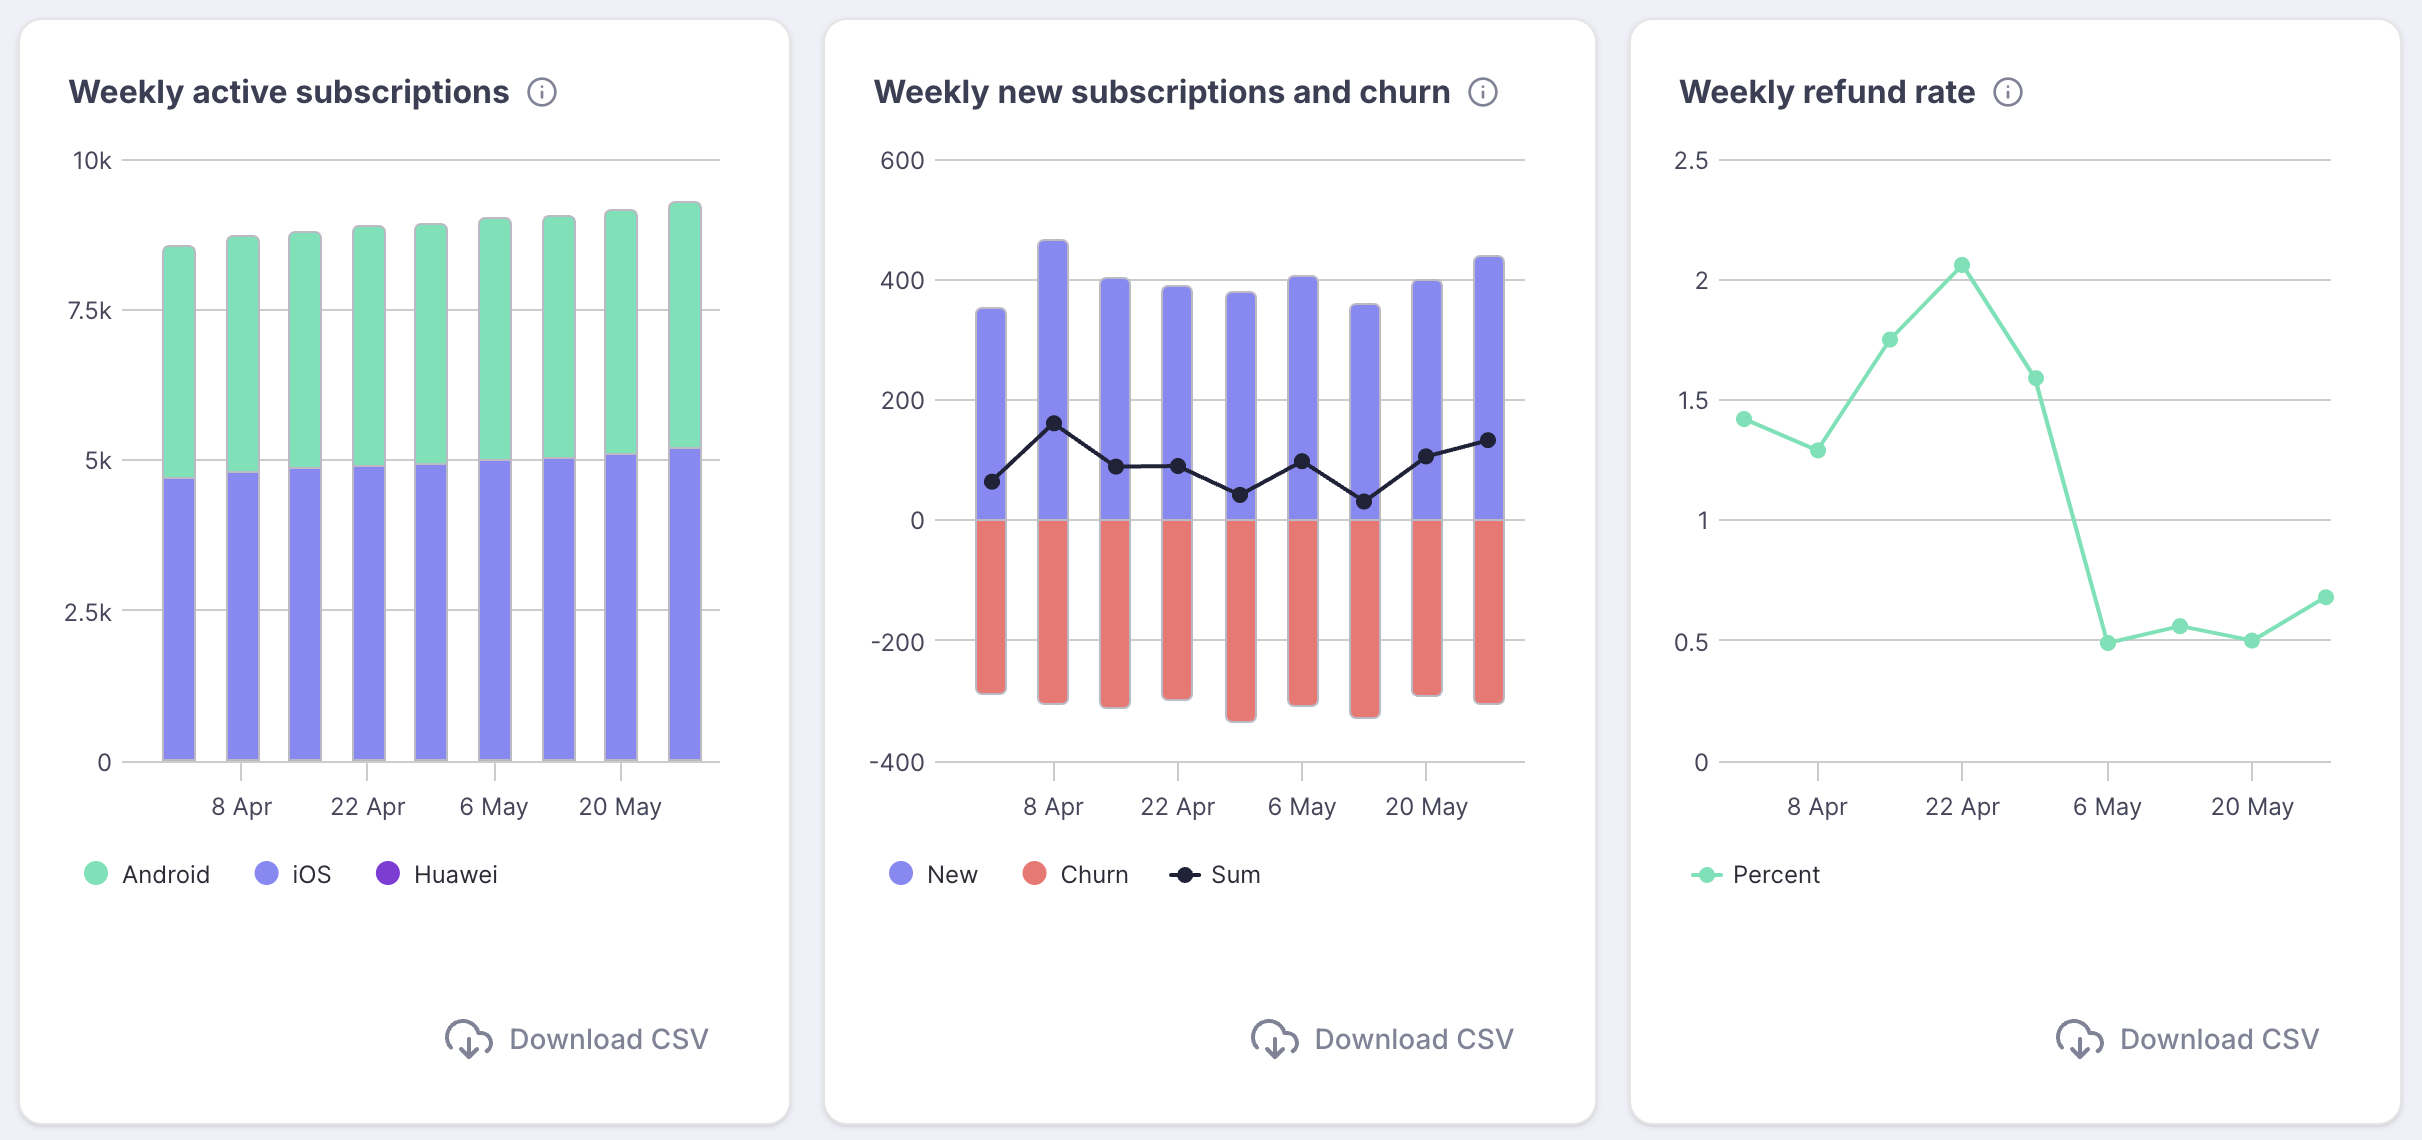
- Daily/weekly/monthly active subscriptions: this chart shows the evolution over time of the number of active subscriptions.
- Subscribers in
Introductory Offer(either free trial or paid trail) and users with the Subscription statusAuto-renewing cancelledorGrace period are included. - Subscriptions in Billing retry are not included are they are not considered as active anymore.
- Subscribers in
- Daily/weekly/monthly new subscriptions and churn: this chart shows the evolution over time of the new subscriptions which started during the visualization period and those who were terminated over the same period.
- Subscriptions in
Introductory Offerand those that have restarted after being terminated are counted as New (blue) - Subscriptions effectively terminated (which includes those in
Billing retryand those who wereRefunded) are counted as Churn (red) - Subscriptions in
Grace periodare excluded as they are considered as still active. - The black curve shows the net balance for each day/week/month (
New - Churn)
- Subscriptions in
Important details on "Active subscriptions" & "New subscriptions and churn" charts
- The filters applied on the chart filter on the current subscription properties, and not the properties it had when it was created. e.g. Adding a filter on "Free Trial" offer type will filter on subscriptions that are currently in Free Trial, and not necessarily those that started with a free trial.
- "New" and "Churn" figures also account for subscriptions that had a plan change, as a plan change creates a new subscription in Purchasely. A plan change will count as +1 in "new" and +1 in "churn" values.
- Daily/weekly/monthly refund rates: the proportion of subscriptions initially taken that were refunded. The date displayed is the date the subscription started not the day of the refund. That means you should expect past days to change.
Revenues
This dashboard shows evolution of the revenue per platform / country or Plan
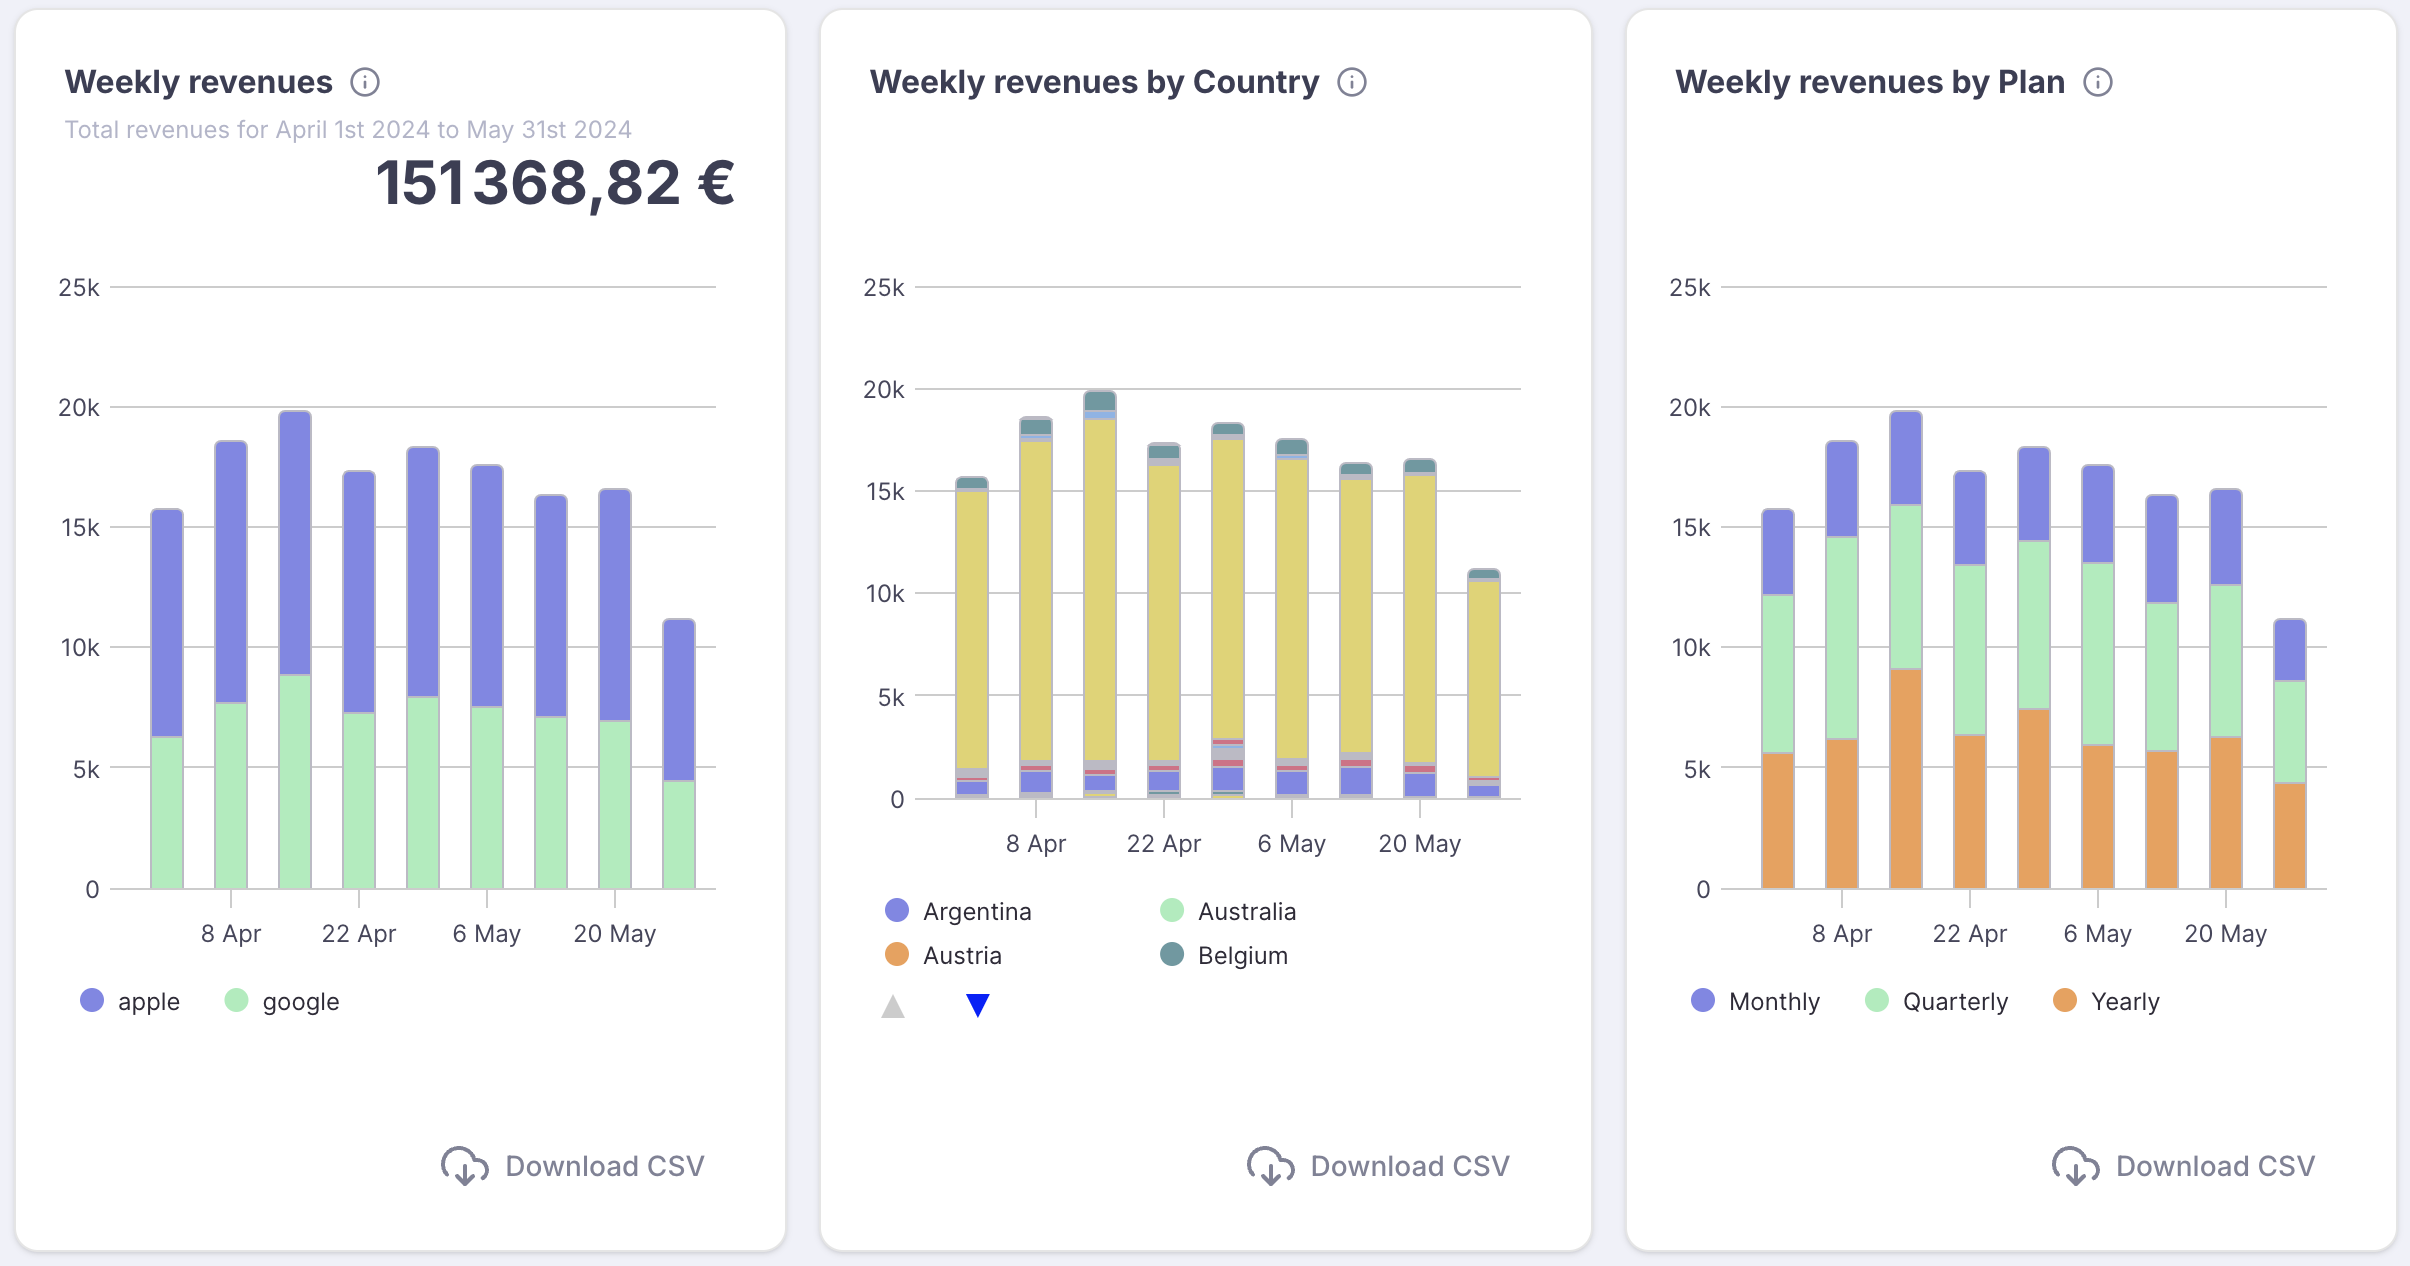
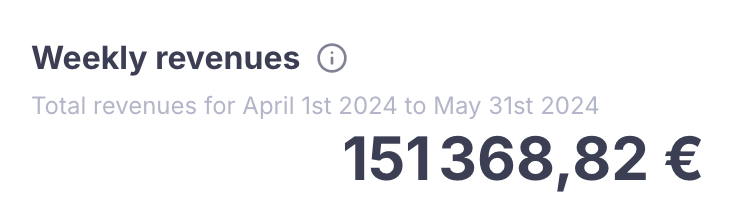
The amount displayed on top of the charts represents the overall revenues generated for the entire visualization range.
Updated 8 months ago