

Analyzing and optimizing your Paywall conversion
This section provides an outlook of how to leverage Purchasely Conversion Dashboard to optimize your paywall conversion
Why optimizing your paywall conversion matters?
Optimizing your paywall conversion is crucial for a mobile subscription app as it directly impacts revenue generation and user retention. A well-designed paywall maximizes the number of free users who convert into paying customers, improving your app's profitability. By enhancing the user experience with clear value propositions and tailored offers, you reduce friction in the decision-making process.
Additionally, understanding and refining your paywall allows you to target the right audience segments, driving sustainable growth. Ultimately, better conversion rates mean higher lifetime value and increased customer loyalty.
How Purchasely can help you optimizing your paywall conversion?
Purchasely helps optimize your paywall conversion by offering a no-code platform that allows you to easily design, test, and personalize your in-app paywalls without needing developer resources. Its A/B testing capabilities let you experiment with different designs, pricing, and messaging to identify what drives the highest conversions.
Purchasely supports dynamic pricing and localization, ensuring that you can tailor offers to different user segments. This flexibility helps boost conversions and revenue from mobile subscriptions.
Additionally, the Conversion dashboard provides you with valuable insights on Paywalls views and conversions. It is a flexible toolbox including filters, group by and split by components that allow you to both understand your conversion from a global perspective (at the app level) and to narrow the view for a particular Paywall, Placement, Audience, Country etc...
Analyzing and optimizing your conversion rate globally inside your app
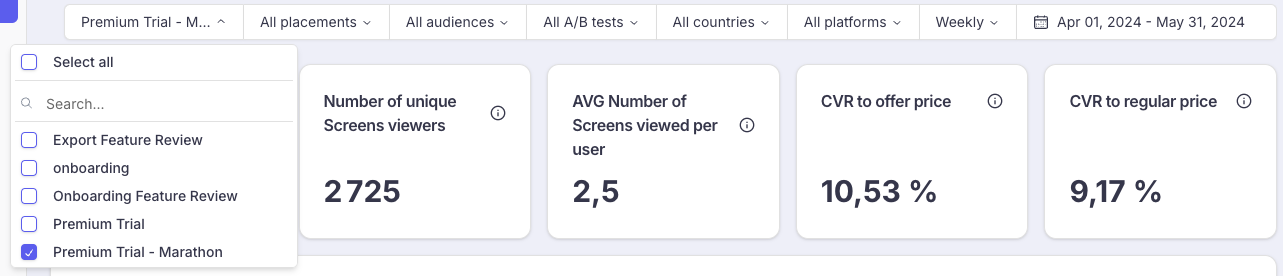
Measuring Screens viewed
To measure the global number of Screens viewed on a specific period, no filter are set in the top bar. You can adjust your visualization period

The dashboard provides the following high level KPIs, matching the period and filter
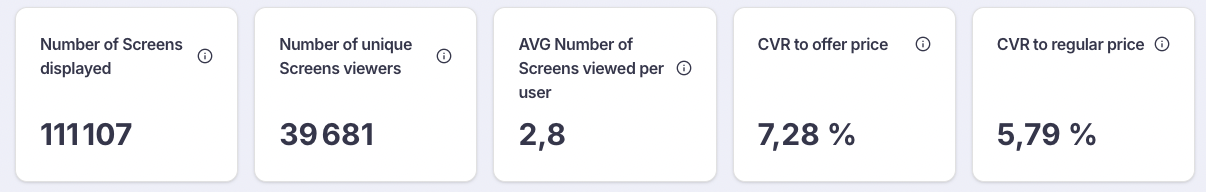
The number of Screens viewed corresponds to the bars of the chart and is associated to the left axis
Screens viewed. The left Y-axis is the one to refer to
Average Screens viewed per UserThis KPI is particularly useful to measure the commercial pressure to which your free users are exposed.
It should be above 1 to make sure that at least every free user is exposed to a Paywall
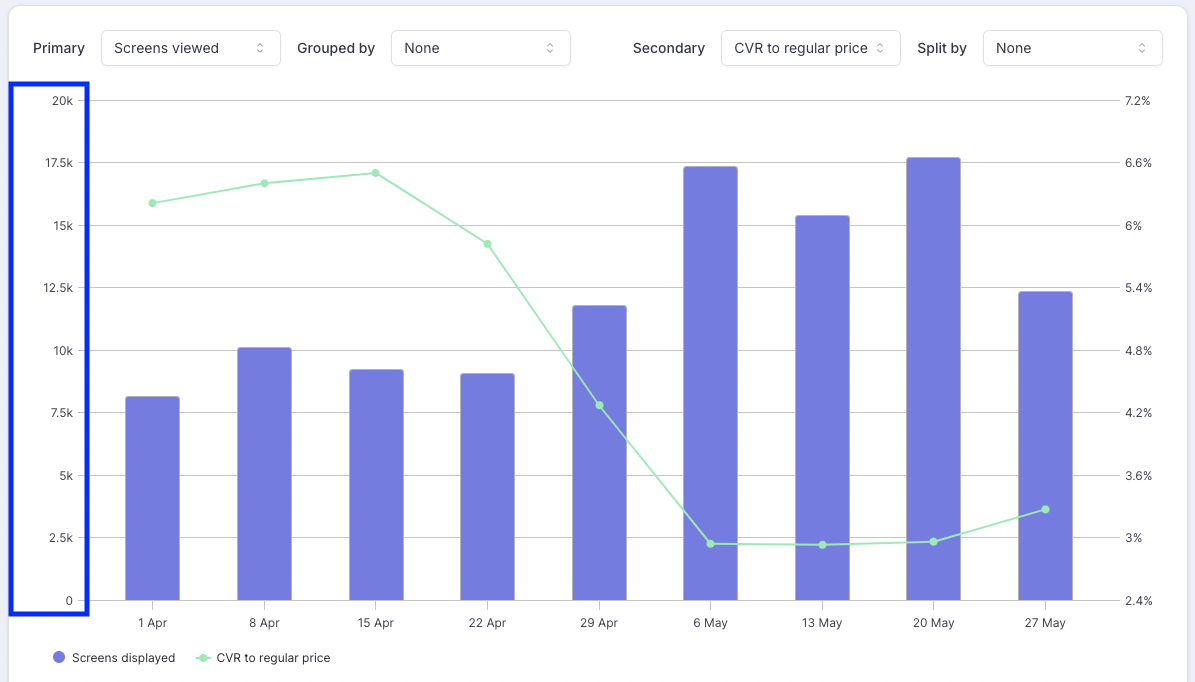
Breaking down the Screens views by Screen
Screens viewed grouped by Screens
This view provides insights on the volumes of impressions for each Screen:
💡 Put your effort on optimizing the Screens that are the most viewed
💡 Don't spend too much time on Screen that are rarely displayed
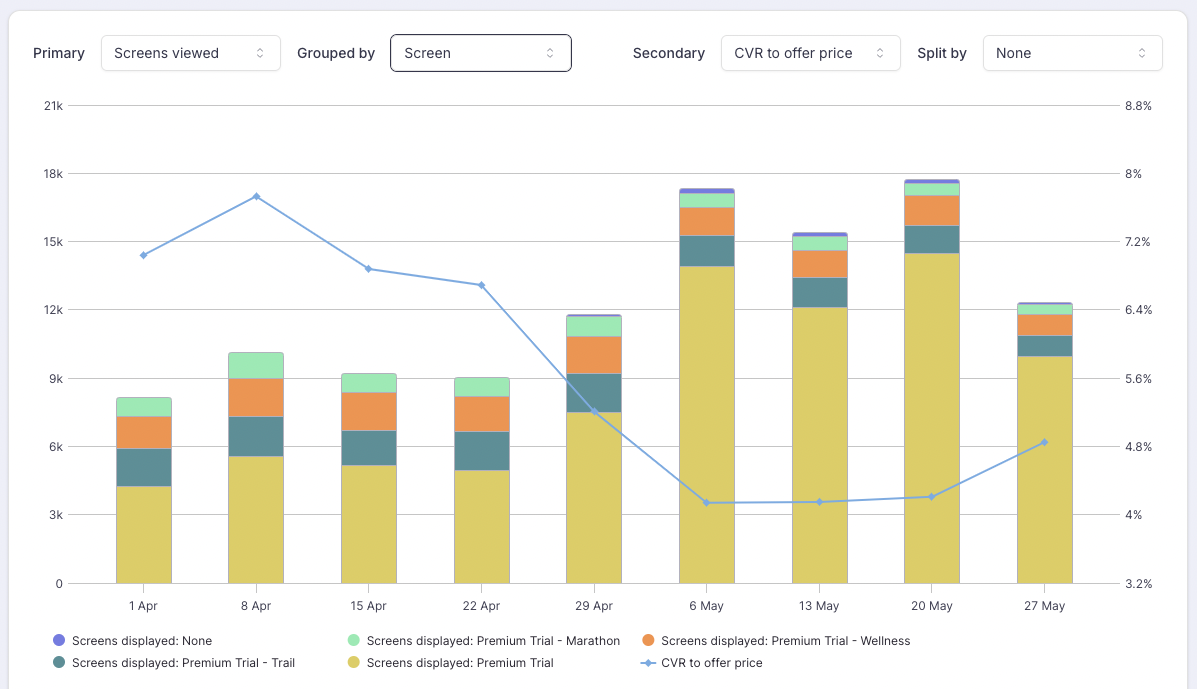
Breaking down the Screens views by Placement
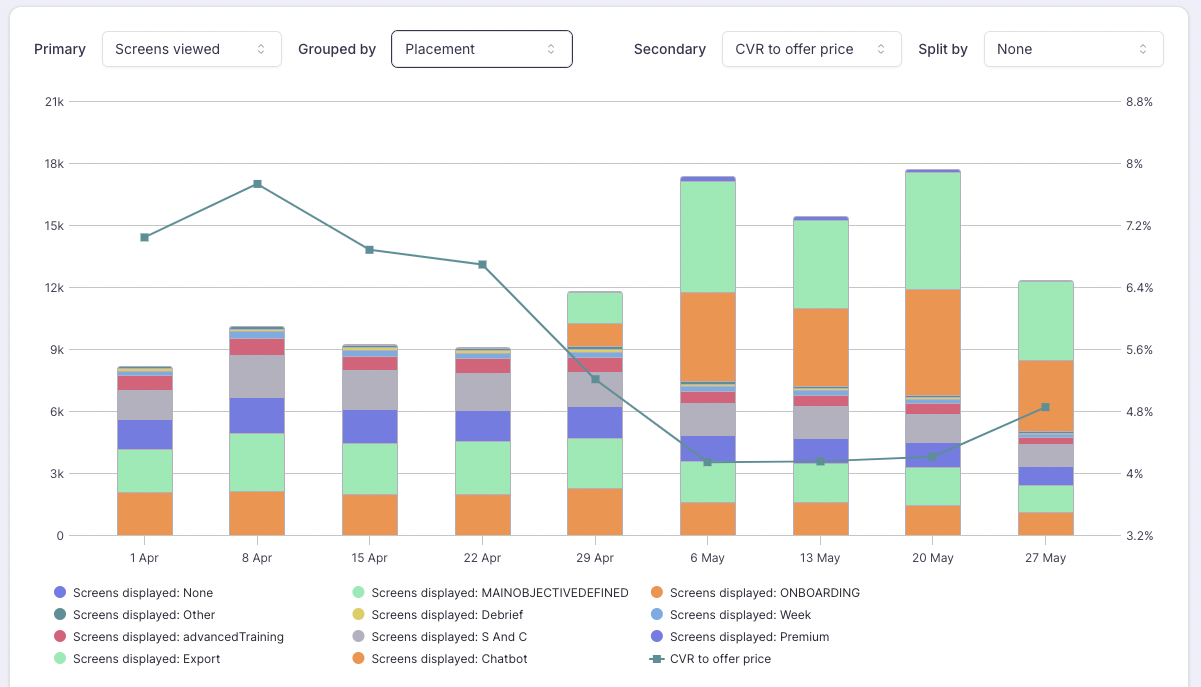
Screens viewed grouped by Placement
This view provides insights on the touch points (Placements) where users are exposed to a Paywall and the corresponding traffic for each Placement
💡 Focus on tailoring the messaging for the most displayed Placement
💡 On the other hand, avoid spending too much time on tailoring the messaging for the Placements that have few traffic.
Breaking down the Screens views by Country
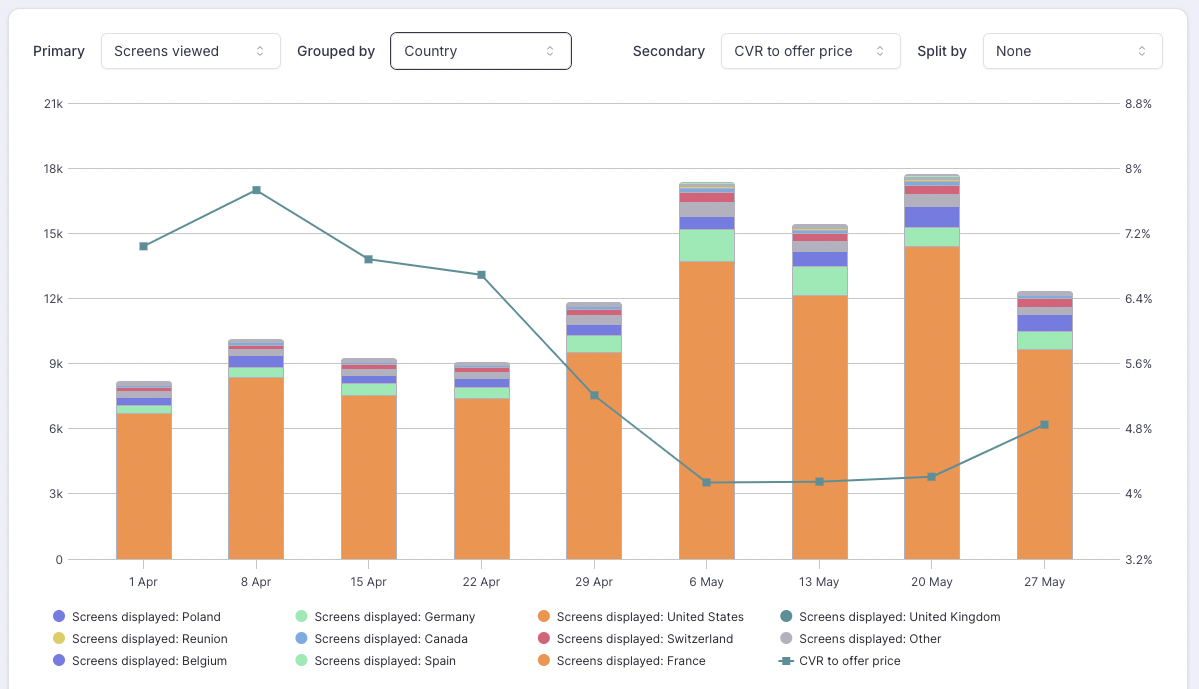
Screens viewed grouped by Country
This view provides insights on the origins of your users by countries:
💡 Use this chart to identify the countries with the best potential of optimization
💡 Tailor the user experience for these countries by localizing your Screens and adjusting the pricing with Price A/B tests
Breaking down the Screens views by Audience
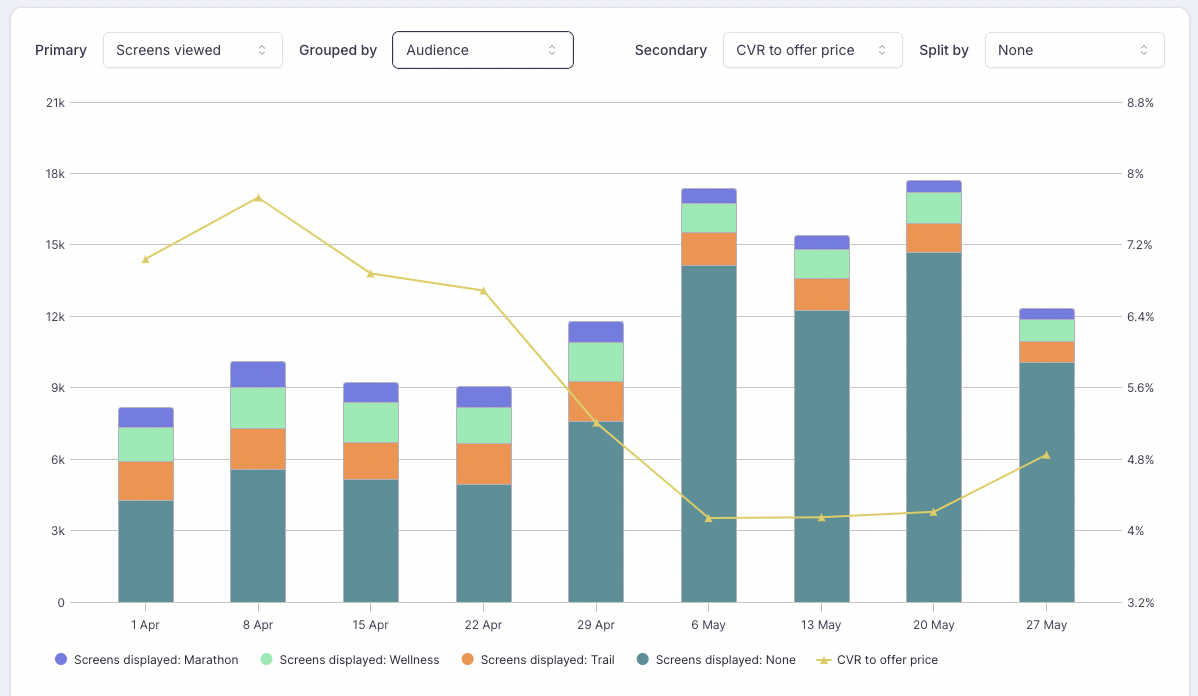
Screens viewed groupes by Audience
If you have built Audiences, this view will allow you to assess how often your different Audiences are exposed to Paywalls:
💡 Use it to identify the most relevant Audiences and then dig deeper for these particular Audiences by setting a specific filter

Visualizing Unique Viewers
The other secondary metric proposed is the number of Unique Viewers.
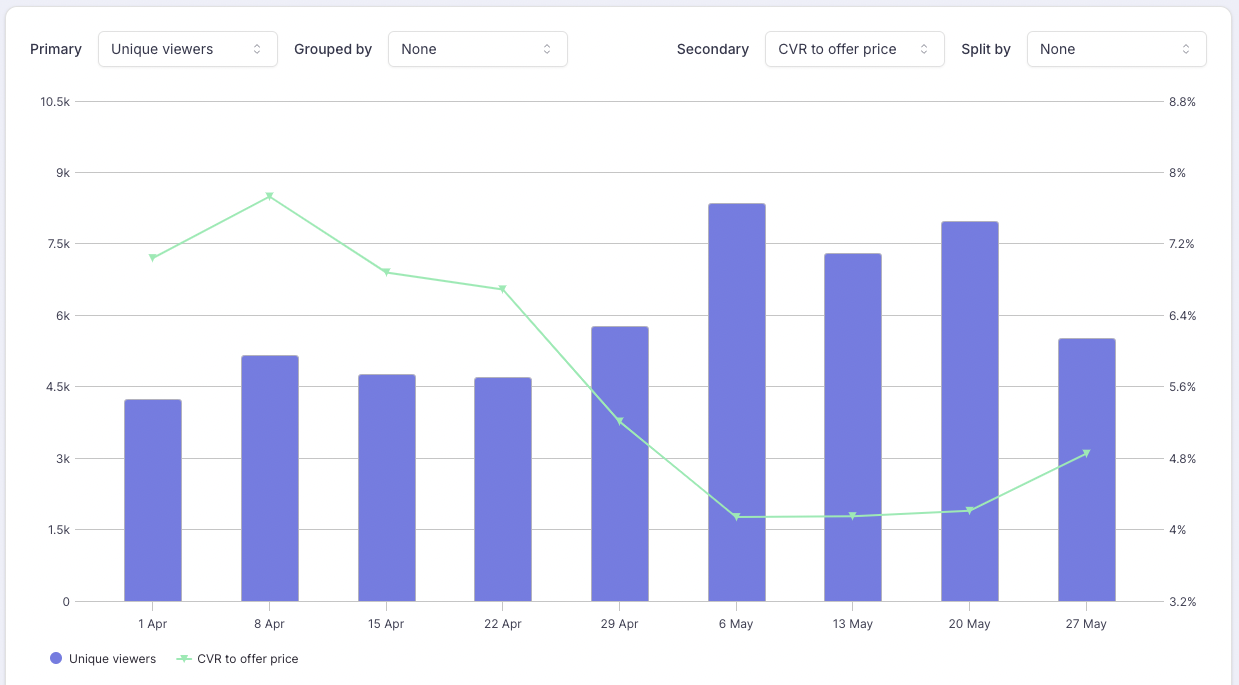
The difference between Unique Viewers and Screens viewed is the following:
when a same User views X Screens Y times the same screen, it will be counted:
- X * Y Screens viewed
- 1 single Unique viewer
Both Unique Viewers and Screens viewed are useful but for different purposes:
- Screens viewed: when you want to understand user behavior and engagement with your Screens over time. This metric is useful for assessing how often users are encountering paywalls or Screens and testing the effectiveness of different designs, pricing, and offers, especially when experimenting with A/B testing or multiple Screen variants.
- Unique viewers: This metric is valuable when you're interested in understanding how many distinct users are exposed to your Screens, which helps in measuring the broader effectiveness of Paywall or Screen exposure in driving Conversions across your User base.
As with Screens viewed, Unique Viewers can be broken down by the same dimensions, by grouping them:
- by Screens
- by Placement
- by Platform
- by Country
- by Audience
- by A/B test variant
Important Notice When Grouping Unique Viewers by Different DimensionsBe cautious when grouping Unique Viewers by different dimensions, as the same user may be counted multiple times, with the uniqueness applying to each specific dimension.
For example:
- If User A views both Screen 1 and Screen 2:
- Without grouping, User A will be counted only once.
- When grouping by screen, User A will be counted once for Screen 1 and once for Screen 2.
As a result, the total number of Unique Viewers without grouping will differ from the number of Unique Viewers when grouped by screen (or any other dimension). This is not a bug or a data discrepancy — different groups are simply not meant to be summed up.
Note that this does not apply to the total number of Screens Viewed, which can be summed across groups.
Visualizing Conversion
Conversion corresponds to the secondary metrics and is visualized as a curve associated to the right axis.
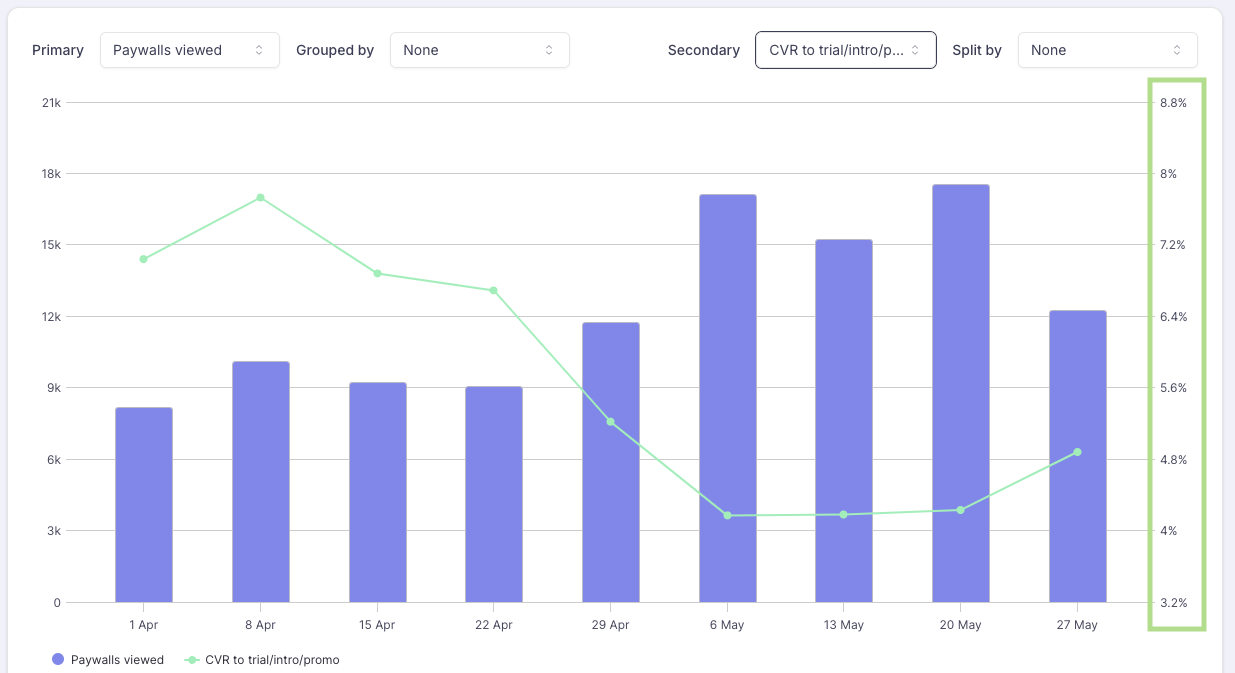
For the secondary metrics, you can chose among:
- CVR to regular price or offer price (Conversion Rates)
- Number of conversions to regular price or offer price (absolute numbers)
- CTR (Click-Through Rate) on purchase button or number of taps on purchase button (absolute number)
Measuring Conversion Rates (CVR)
Conversion Rates are the ratio between the number of Conversions and the number of Unique Viewers:
CVR = # Conversions / # Unique Viewers
It is often the case that a higher number of Paywalls views or Unique viewers is correlated to a lower Conversion Rate (in other words, when the blue bars increase, the conversion curve goes down).
When the CVR goes down while the number of Paywalls viewed or Unique Viewers goes up, it might mean that the paid User Acquisition has decreased in quality.
CVR to offer price
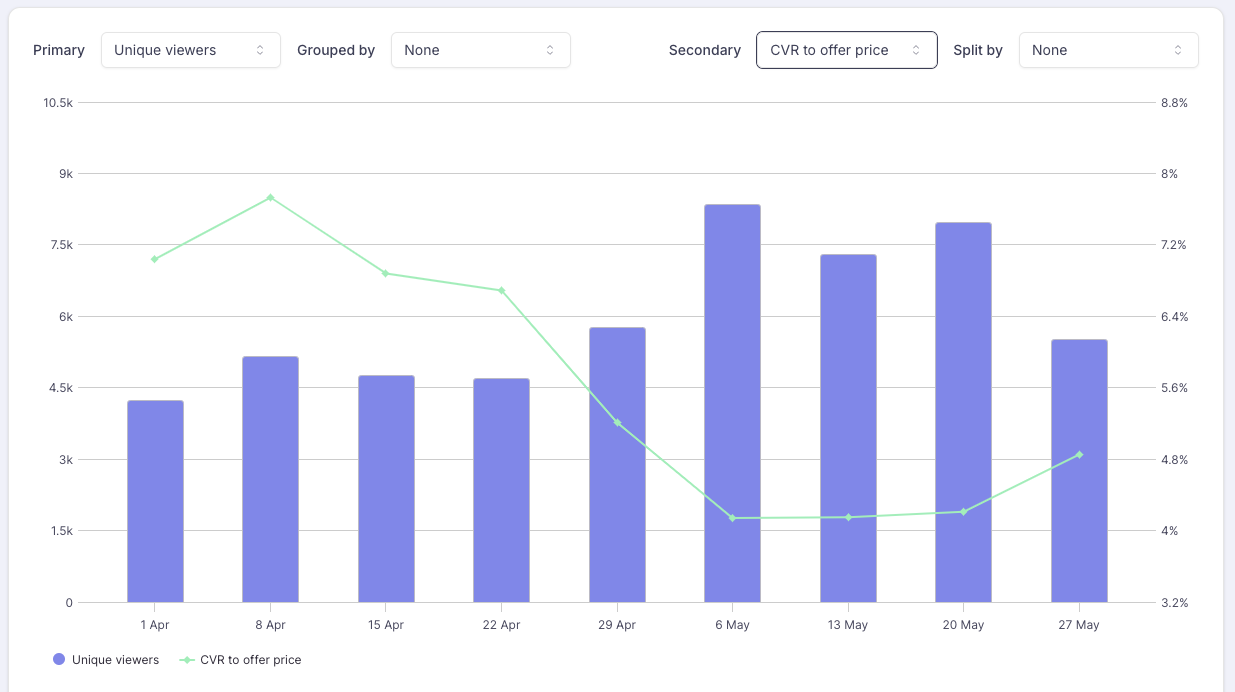
Conversion Rate to Offer price
This view provides insights on the proportion of your users which you've been able to convince to give a shot to and try your product for free.
The CVR to Offer price can be outlooked but it is not the main KPI to optimize as users in this stage do not generate substantial revenue yet (or no revenue at all if you are proposing a free trial).
CVR to regular price
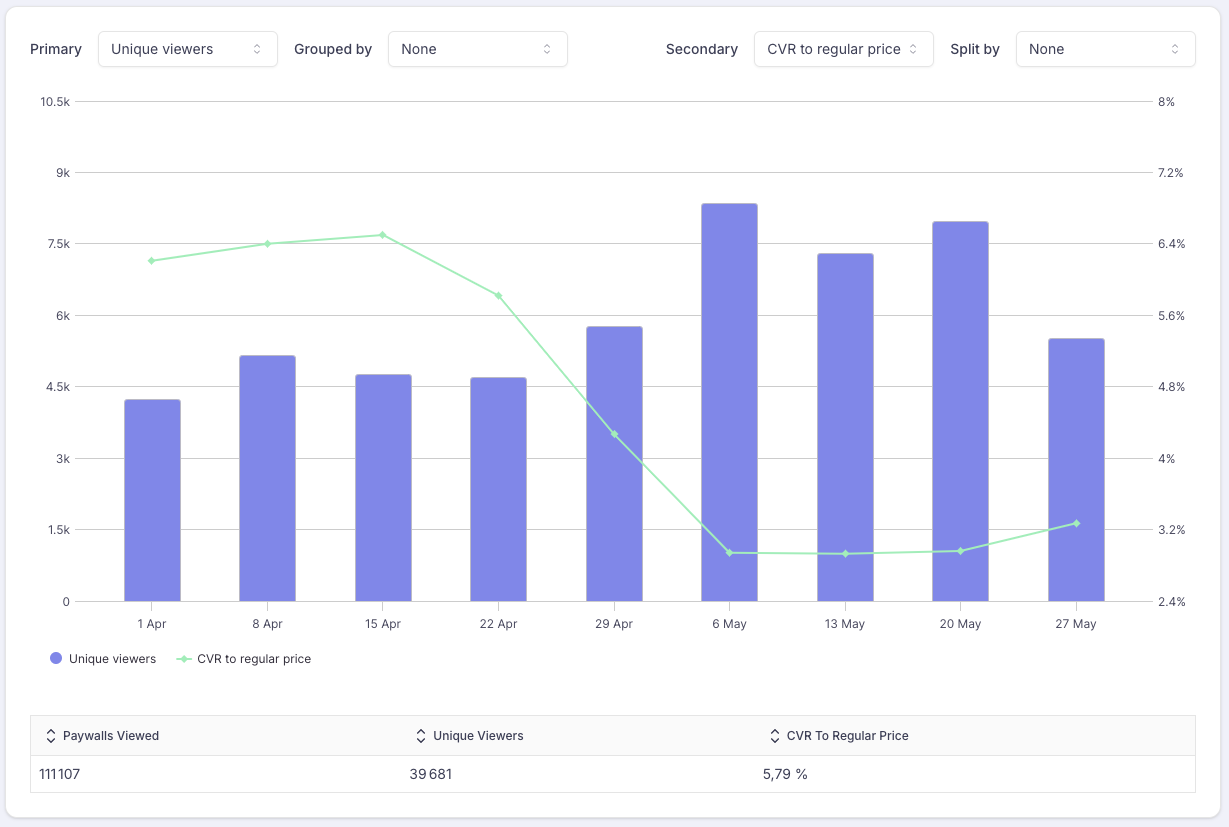
Conversion Rate to Regular price
This view provides insights on the proportion of your users which end up paying the regular price for your subscription.
The CVR to Regular price is the main monetization KPI that you should try to optimize.
Breaking down Conversion Rates by Plan
-
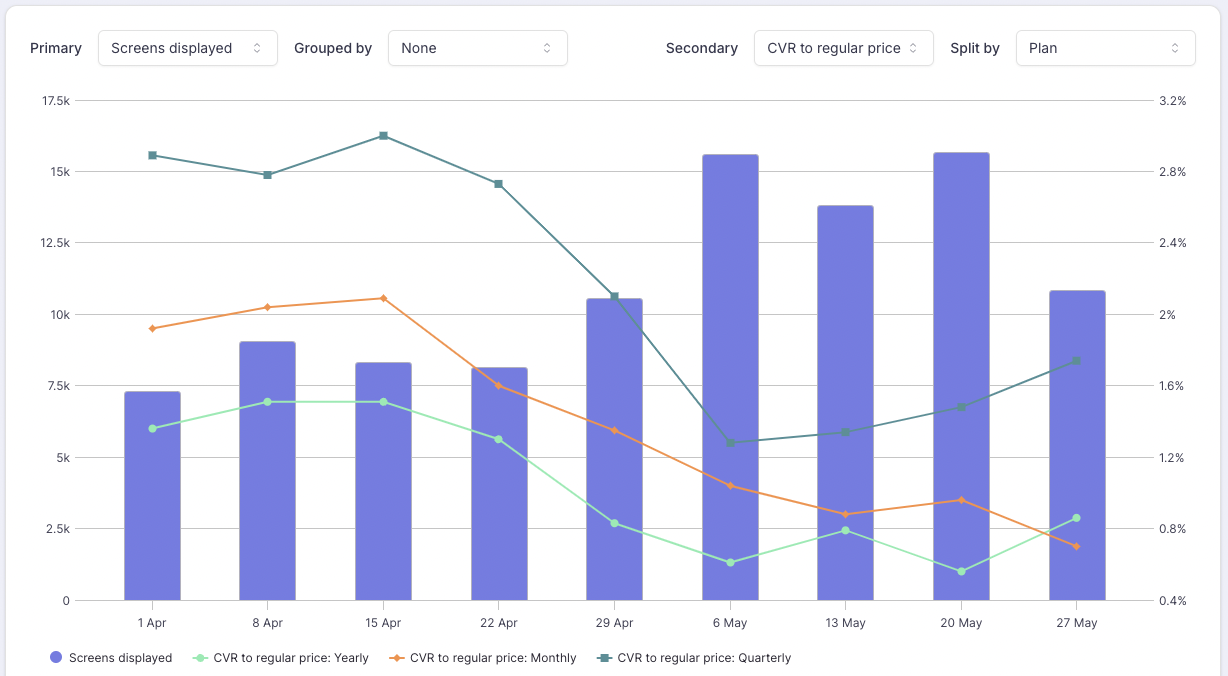
This view provides insights on the respective CVR for each Plan presented in your Paywalls.
Breaking down Conversion Rates by Placement
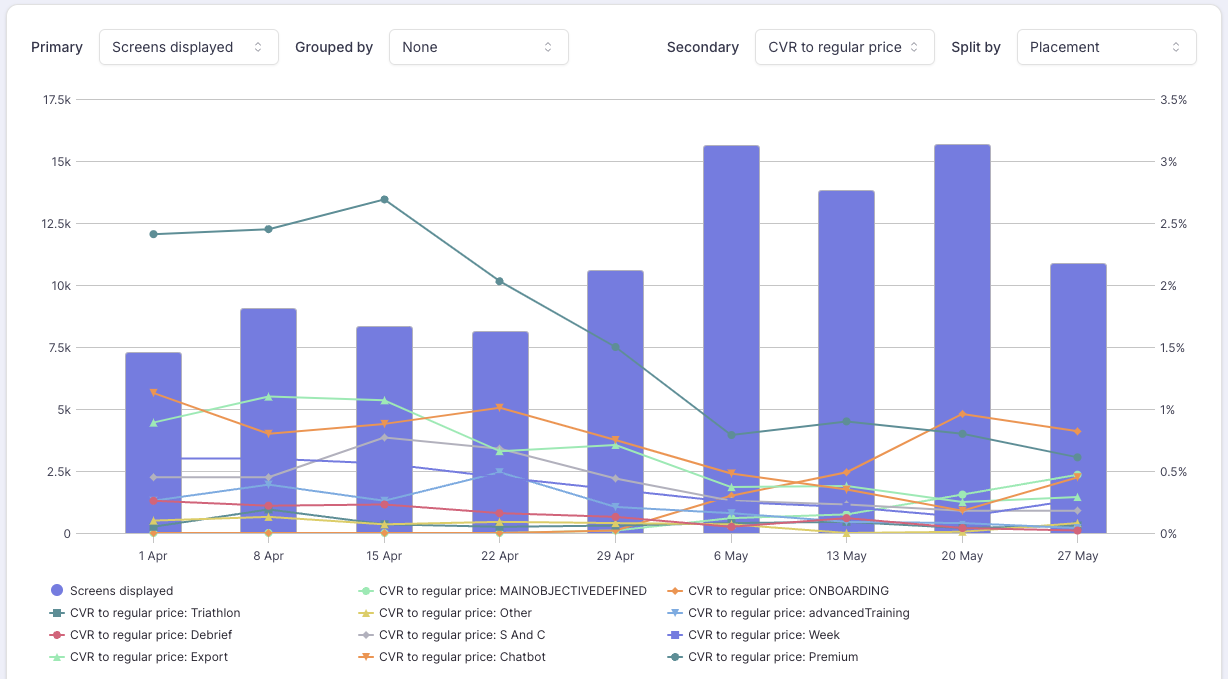
This view provides insights on the CVR for each Placement
💡 Focus your efforts on improving the Placements which are the most viewed with the lower CVR for a bigger impact.
💡 Assess in parallel the CVR and the absolute number of Conversions for the different Placements
Breaking down Conversion Rates by Country
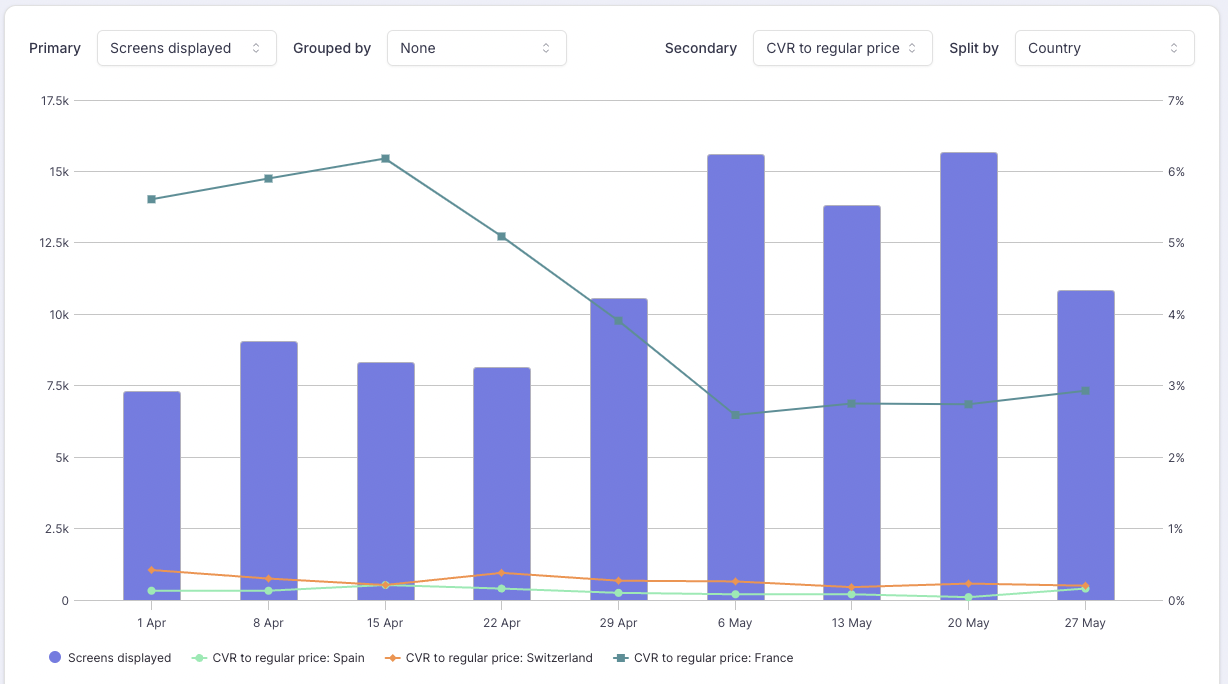
This view provides insights on the CVR for each Country
💡 Focus your first efforts on improving it for the tier 1 countries (the ones with high volumes of Unique Viewers and high CVRs)
💡 Then tailor the Paywall copy or prices for Tier 2 countries (the ones with high volumes of Unique Viewers and low CVRs) by launching a set of Paywall experiments or A/B tests
Breaking down Conversion Rates by Platform
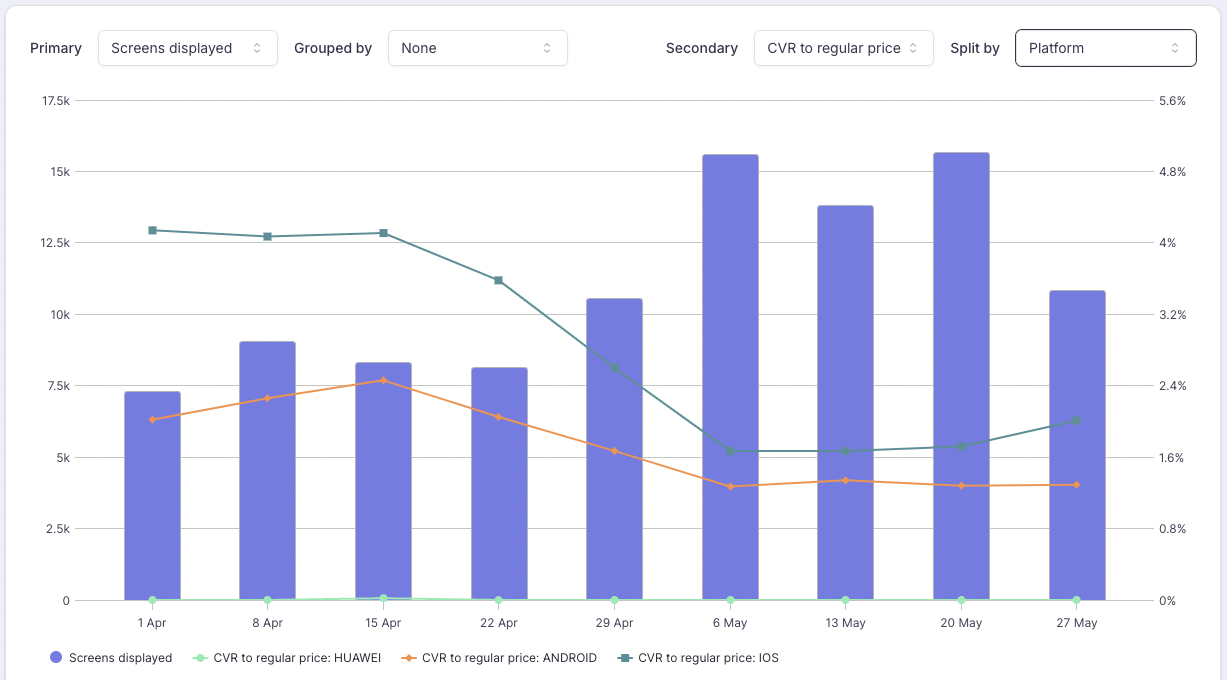
This view provides insights on the CVR per Platform
💡 In most cases, iOS has a higher CVR because of iOS users generally have more financial means and a higher propensity to purchase compared to Android users
💡 Put more efforts on optimizing iOS CVR as you will get a better ROI on your actions
Breaking down Conversion Rates by Audience
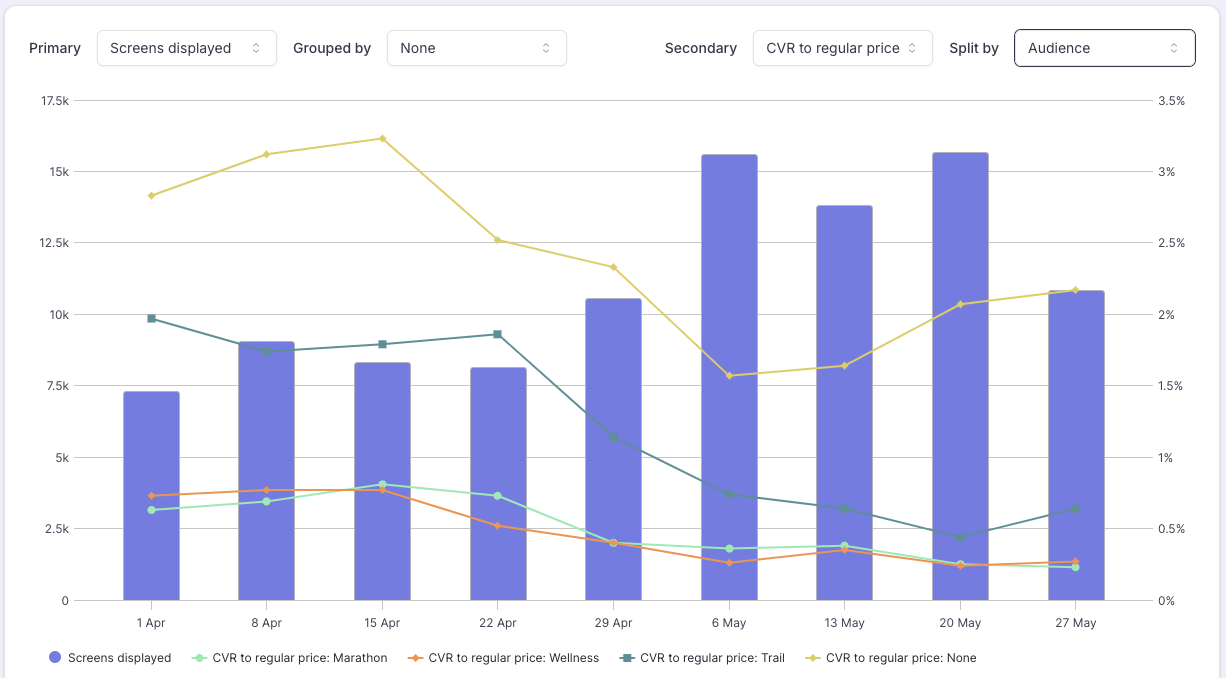
This view provides insights on the CVR per Audience
💡 Tailor the copywriting of your Paywall specifically for each Audience
💡 Sell the value created by your app in a user centric manner rather than the features of the app
Measuring the Number of Conversions
Numbers of Conversions are absolute numbers, as opposed to CVRs which are ratios. They are useful to measure the volume of Conversions absolutely, without taking the number of Screens viewed or Unique Viewers into consideration.
Contrary to CVRs, you should not observe the correlation where the Conversion go down when the Screens viewed go up. In most of the cases, Conversions (i.e.: the curves) should go up when Screens viewed or Unique Viewers (i.e.: the bars) go up.
Number of Conversions to offer price

Number of conversions to Offer price
This view provides insights on the number of conversions to an Offer price. Users convert to Offer prices when they start an Introductory offer, redeem an Offer code or a Promotional Offer.
This metrics is therefore useful both for Conversion Paywalls and Paywalls meant to retain or win-back Users by proposing Promotional Offers.
Number of Conversions to regular price
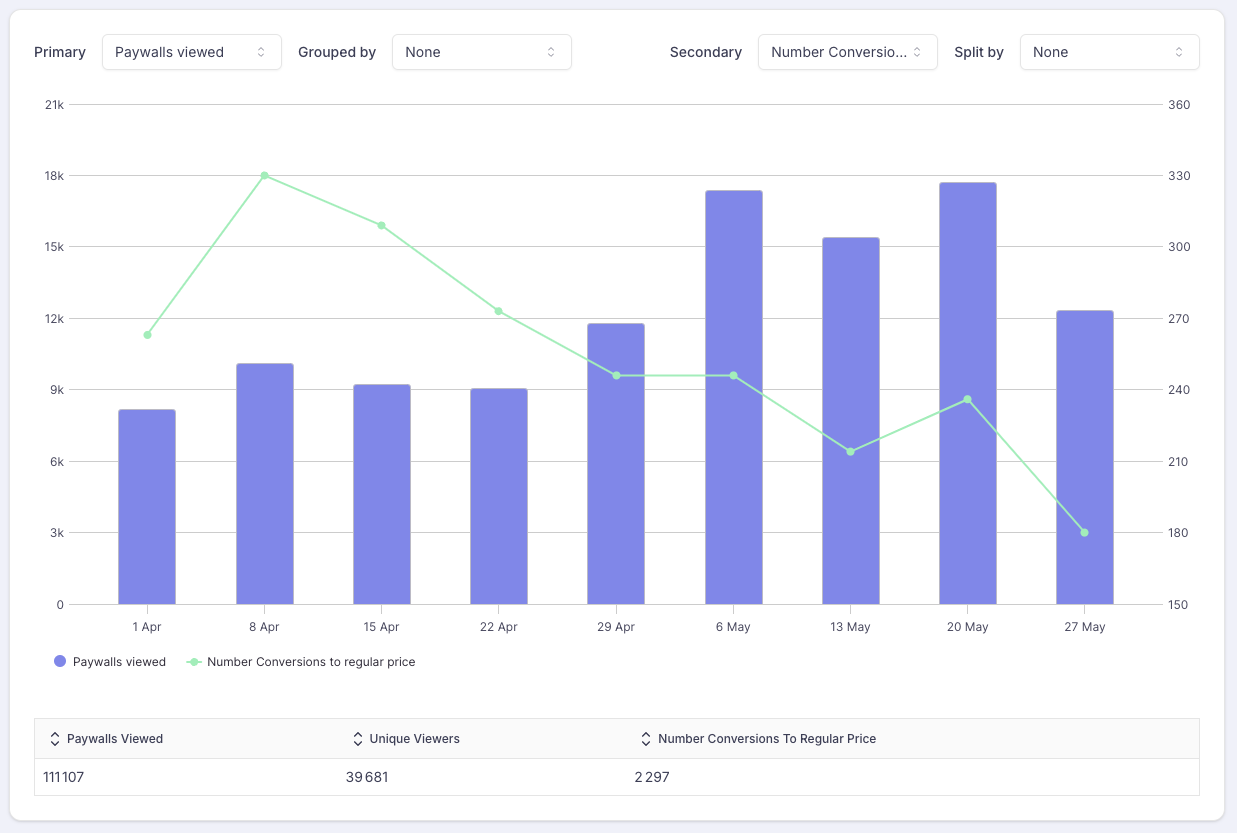
Number of conversions to Regular price
This view provides insights on the number of conversion to the Regular price (users who pay their subscription without benefiting from any particular Offer). This happens in 3 cases:
- when users convert their Introductory Offer / Promotional Offer / Offer code, without cancelling their subscription
- when no Introductory Offer have been configured for the subscription
- when the user starts a new subscription and has already benefited from the Introductory Offer (for the same subscription or another subscription within the same subscription group)
Contrary to the CVR, it is an absolute number which is shown here, which means that it should not decrease when the number of Screens displays increases.
Visualizing purchase intents
Click-Through Rates (CTR) on purchase buttons
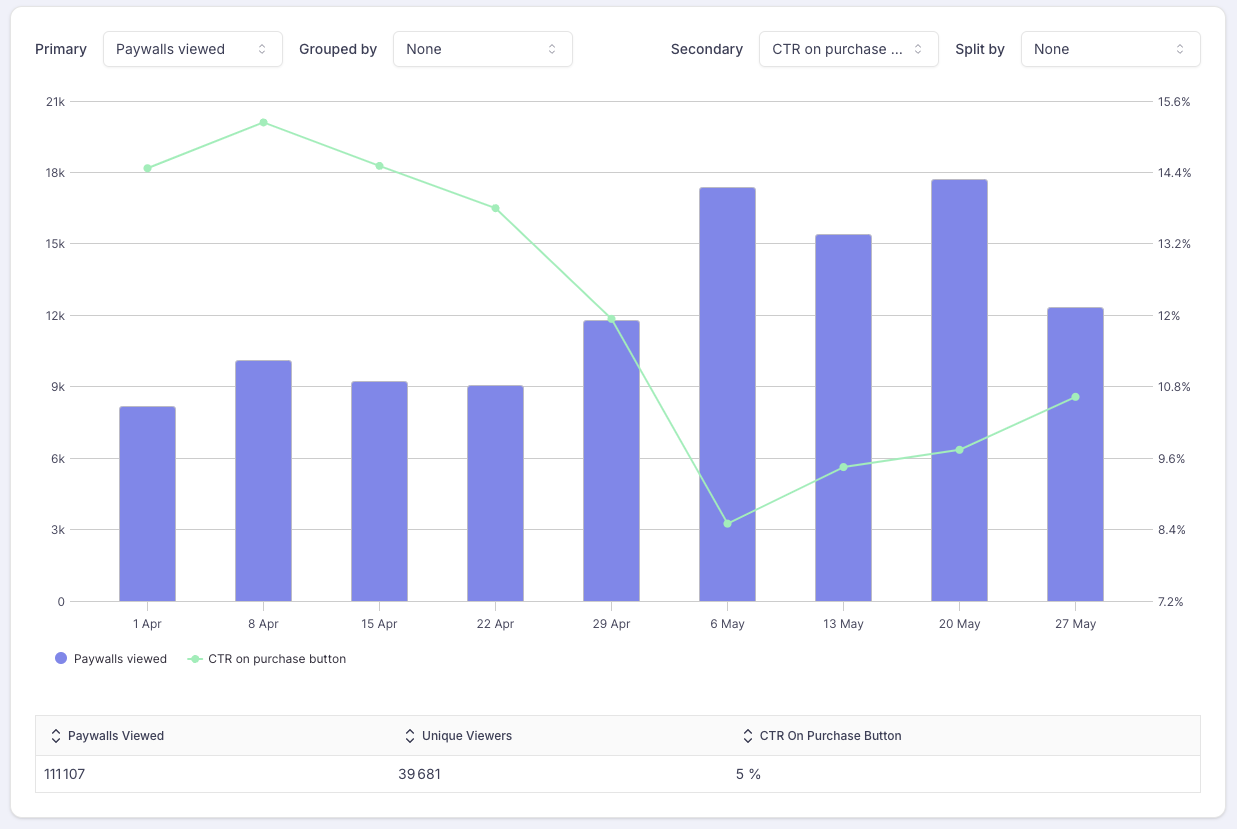
CTR on purchase buttons
This view allows you to assess how the proportion of unique viewers who have engaged with your Paywalls with the intent to make a purchase.
Surprisingly, there is an important drop-off between the intent and the finalization of the purchase which can go up to 85%.
Number of taps on a purchase button
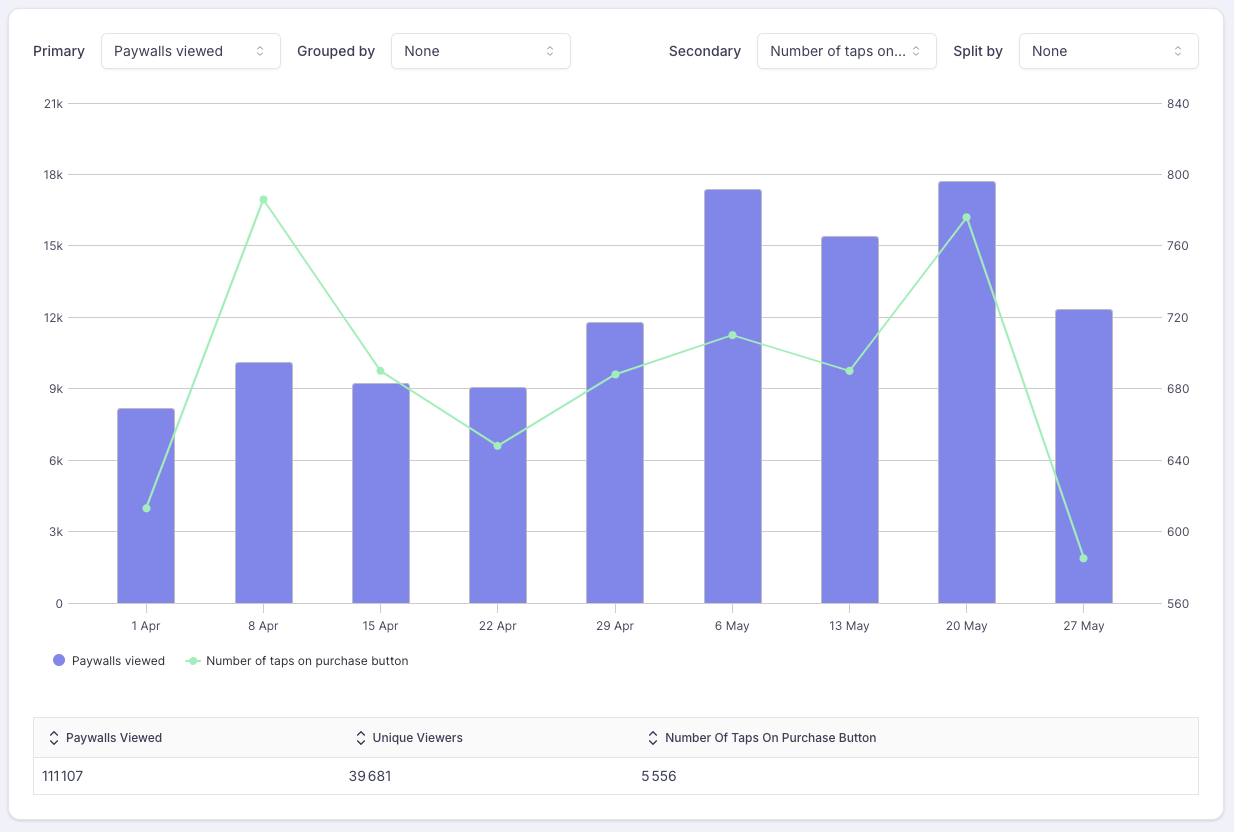
Number of taps on a purchase button
This view allows you to assess how many unique users have engaged with your Paywalls with the intent to make a purchase.
This view can help you assess the potential of creating an automation equivalent to the "abandoned cart" in eCommerce.
Analyzing and optimizing the Conversion for a specific Paywall, Placement, Audience, Platform
To narrow the data visualized in the chart for a particular Screen or Placement, you can use the filters on top of the screens.
Different filters can be combined together.
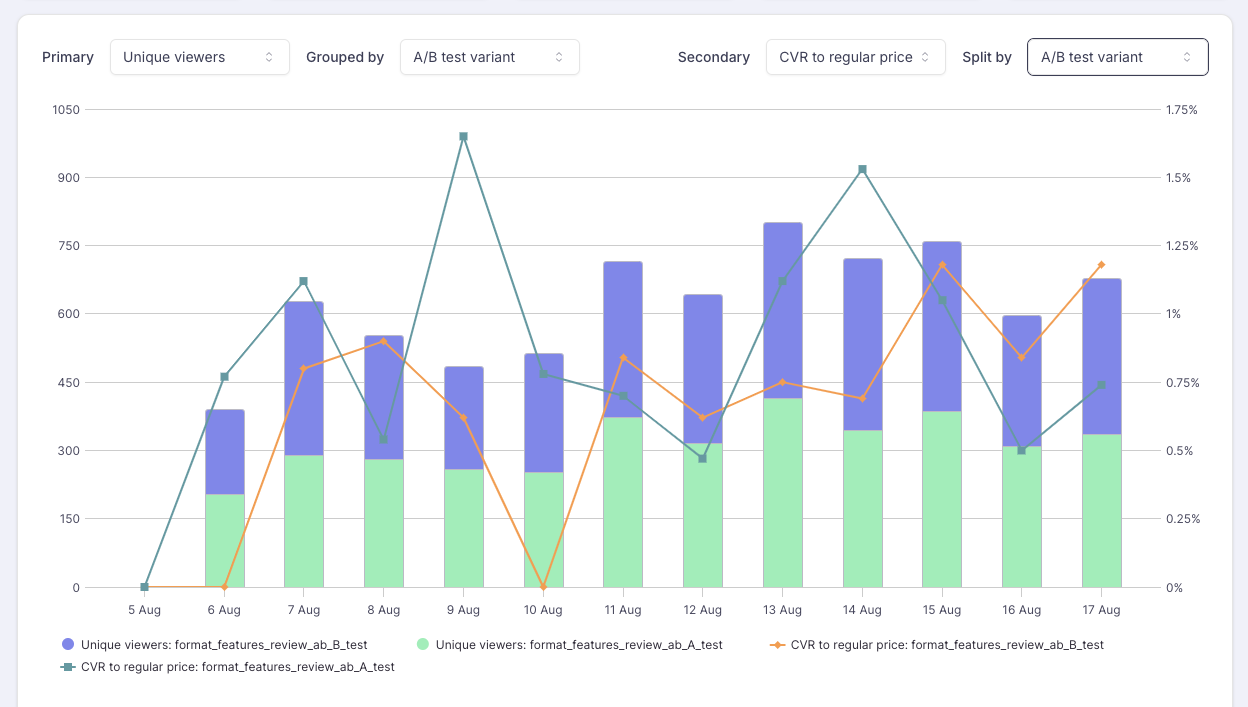
Comparing the Conversion for the different variants of an A/B Test
If you want to compare the performance of a specific A/B test, follow these instructions:
-
Set a filter for the desired A/B test
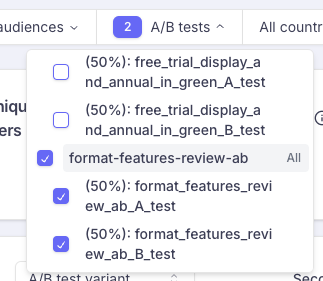
Tick the parent checkbox (the A/B test itself) which includes the 2 variants
-
Group the primary metric (unique viewers) by A/B test variant
-
Split the secondary metrics by A/B test variant
You can now compare the 2 variants by period (day / week or month)
Optimizing the Conversion locally for a specific Country
You can identify your top countries by grouping the unique viewers by country and splitting the conversions by country too.
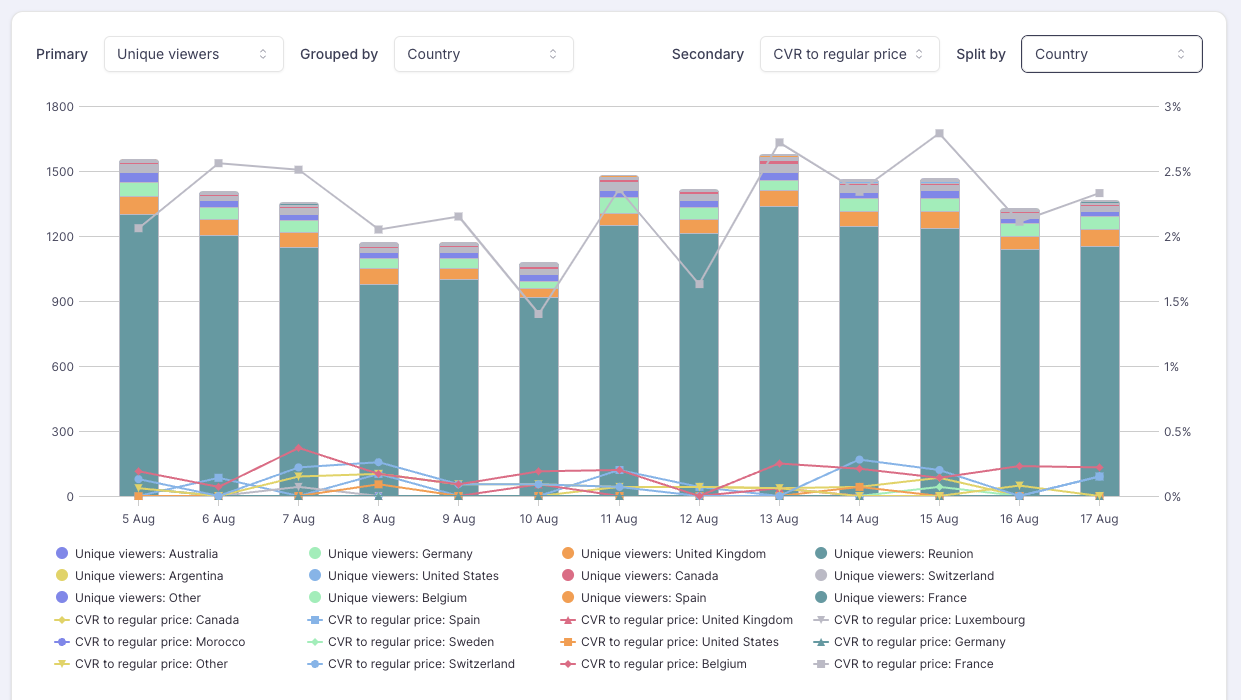
Once you've identified which countries are worth optimizing, you can deepen your analysis for a particular country or set of countries, by setting the corresponding filter.
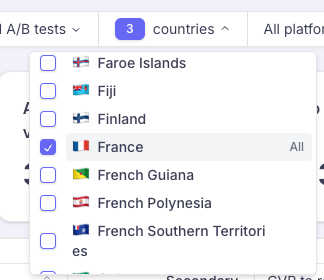
All the data will then be filtered for this particular country / set of countries.
Updated 8 months ago