
Dashboard - Conversion analysis
This section provides details on the Conversion Dashboard
Overview
Purchasely’s Conversion Analysis provides insights into the user purchase journey, allowing you to visualize and optimize conversion funnels. By offering customizable funnel analysis, advanced segmentation, and key performance metrics, this feature helps identify drop-off points and optimize the purchase process. It supports data-driven decision-making with actionable insights, enabling you to improve conversion rates for your Paywalls.
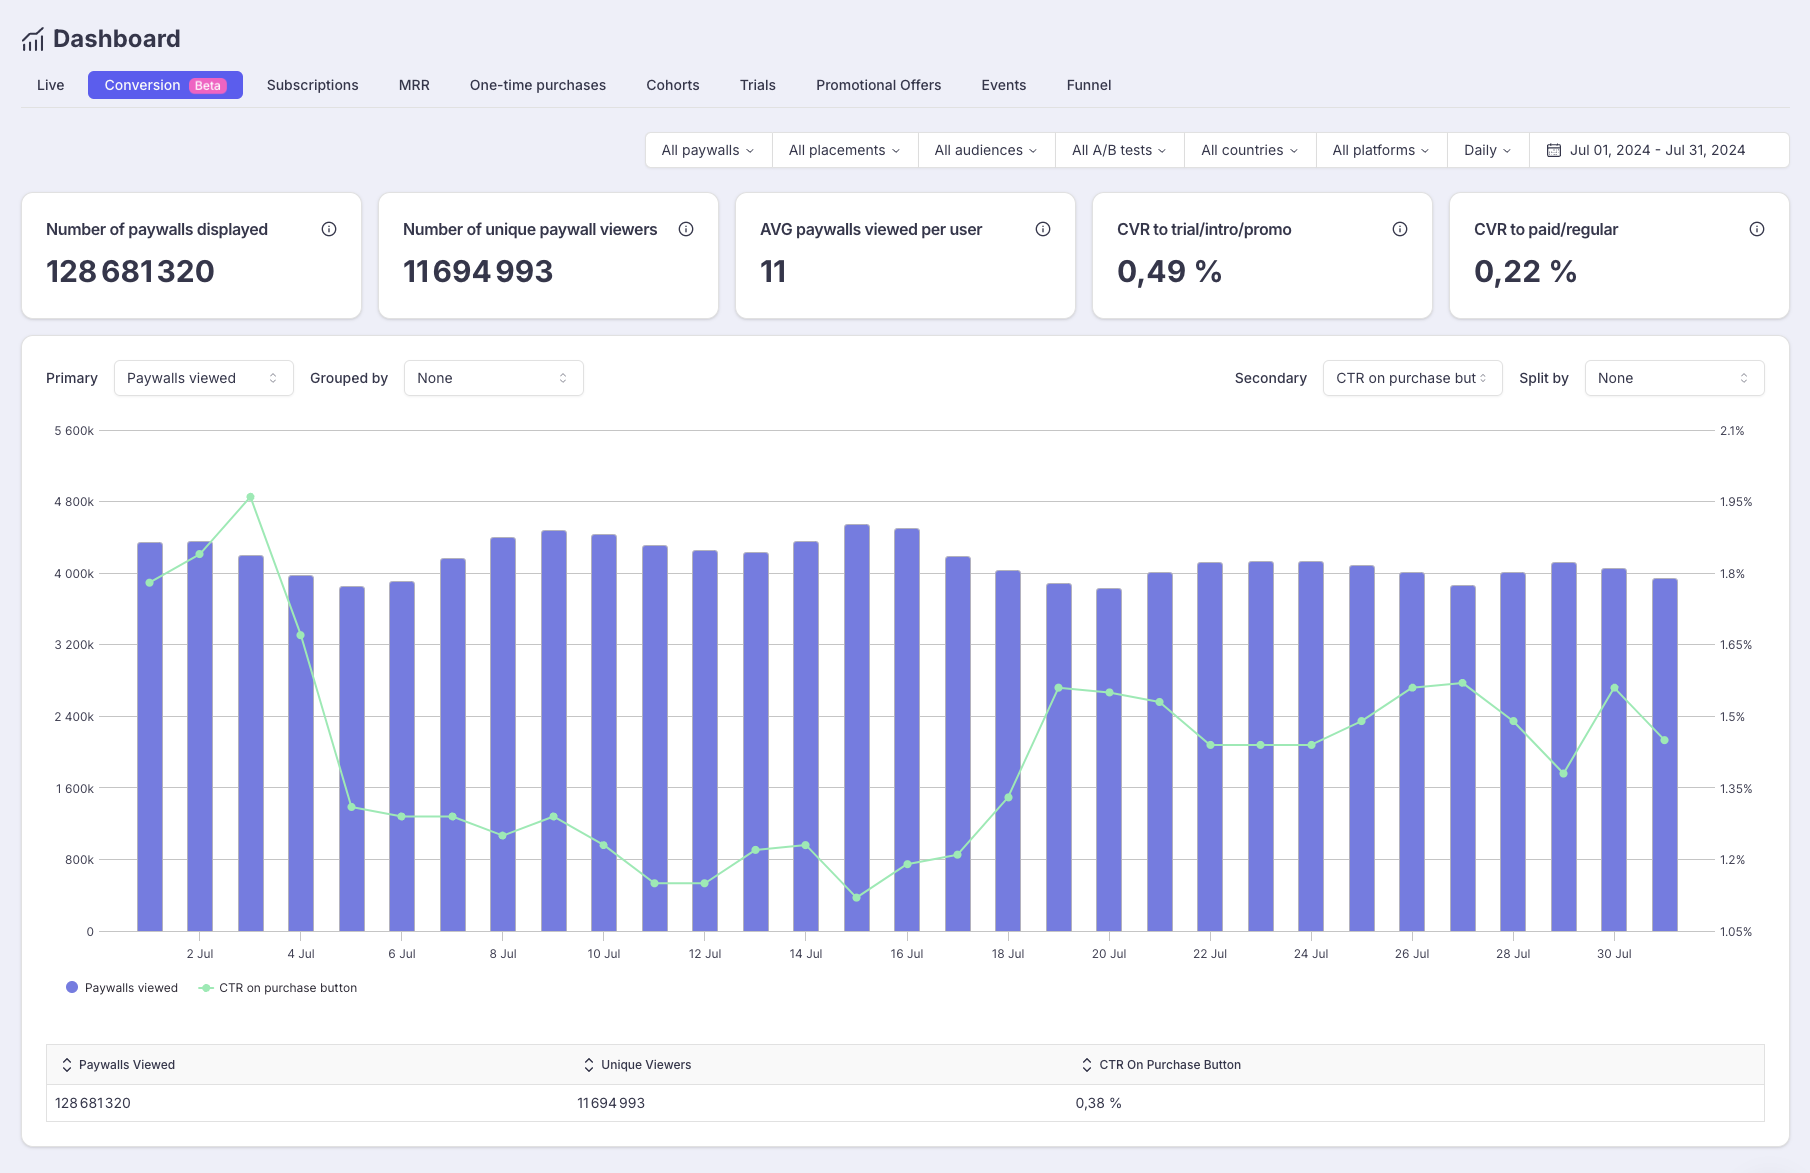
The feature allows you to visualize on a single chart:
- bars which represent a Primary metric related to Paywalls displayed.
- curves which represent a secondary metric related to Conversion.
Visualizing these 2 metrics together on the same date allows you to see the potential correlations between the 2 metrics.
Filters
On the top right of the Dashboard, you can leverage different filters, and define the period

The data displayed or visualize in the KPIs, chart and table below will be filtered accordingly.
Here are the filters available:
- Paywalls: filter the data for a specific Paywall or set of Paywalls.
- Placements: filter the data for a specific Placement or set of Placements
- Audiences: filter the data for a specific Audience or set of Audiences
- A/B tests: filter the data for a specific A/B test, AB test variant or set of A/B tests or A/B test variants.
- Countries: filter the data for a specific country or set of countries.
The country used is the Store Country when available (SDK version >= 4.4.0) or IP Country if not. - Platforms: filter the data for a specific Platform (iOS / Android)
You can also define the time unit (Daily / Weekly / Monthly) and the time range.

If you don't set any filter, you'll rather have a global perspective on your users' behavior.
If you set filters for a particular Paywall, Placement, Audience or Country, you will rather have a detailed overview allowing you to optimize locally a particular Paywall, Placement, Audience or Country.
Primary metric
The Primary metrics is related to Paywalls viewed. It leverages the UI / SDK Event PRESENTATION_VIEWED.
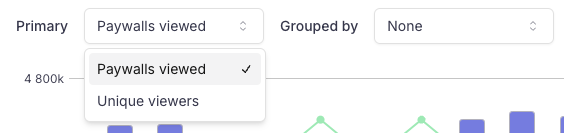
You can choose among:
- Paywalls viewed- a same User who sees 2 different Paywalls or twice the same Paywall during a time unit (day/week/month) will be counted twice.
- Unique viewers - a same User who sees 2 different Paywalls or twice the same Paywall during a time unit (day/week/month) will be only counted once.
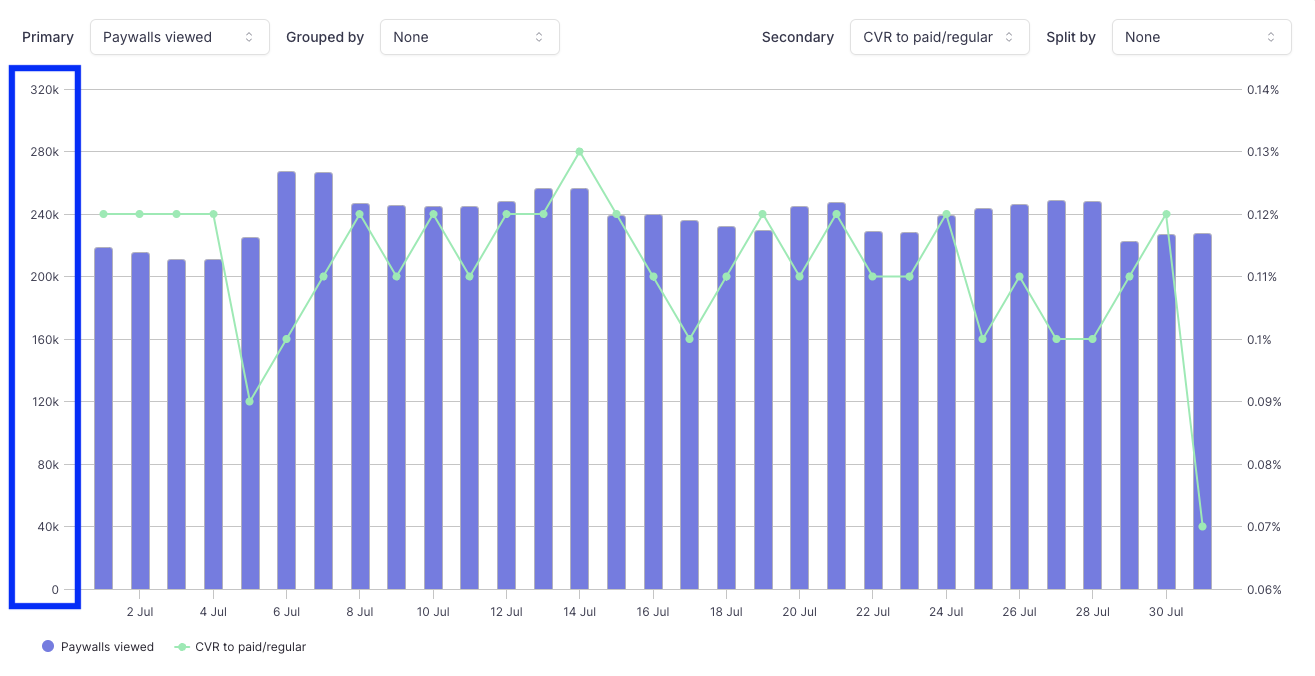
The Primary metrics corresponds to the units on the left axis.
This Primary metrics can be grouped by different dimensions: Audience / Country / Paywall / Placement / Platform
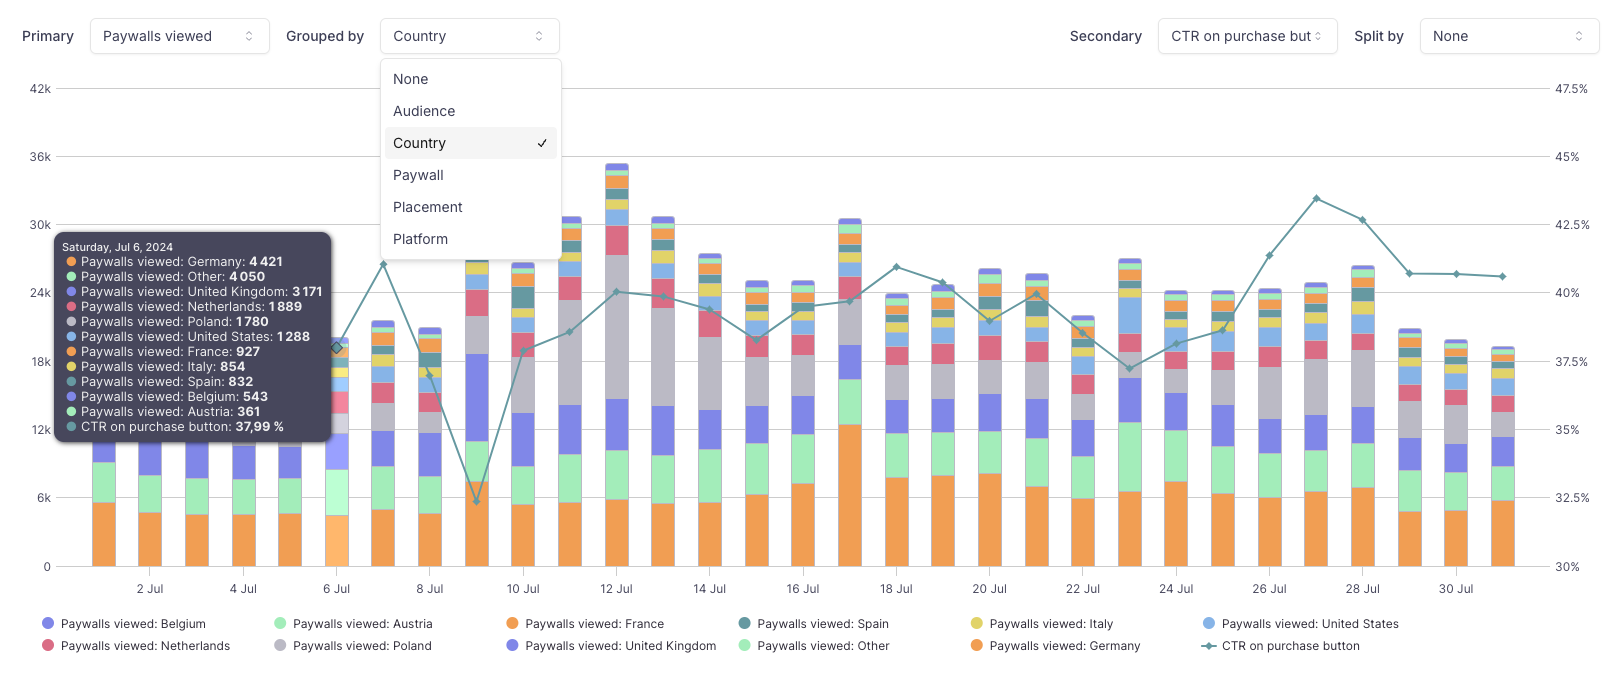
Example of Paywalls viewed grouped by Country
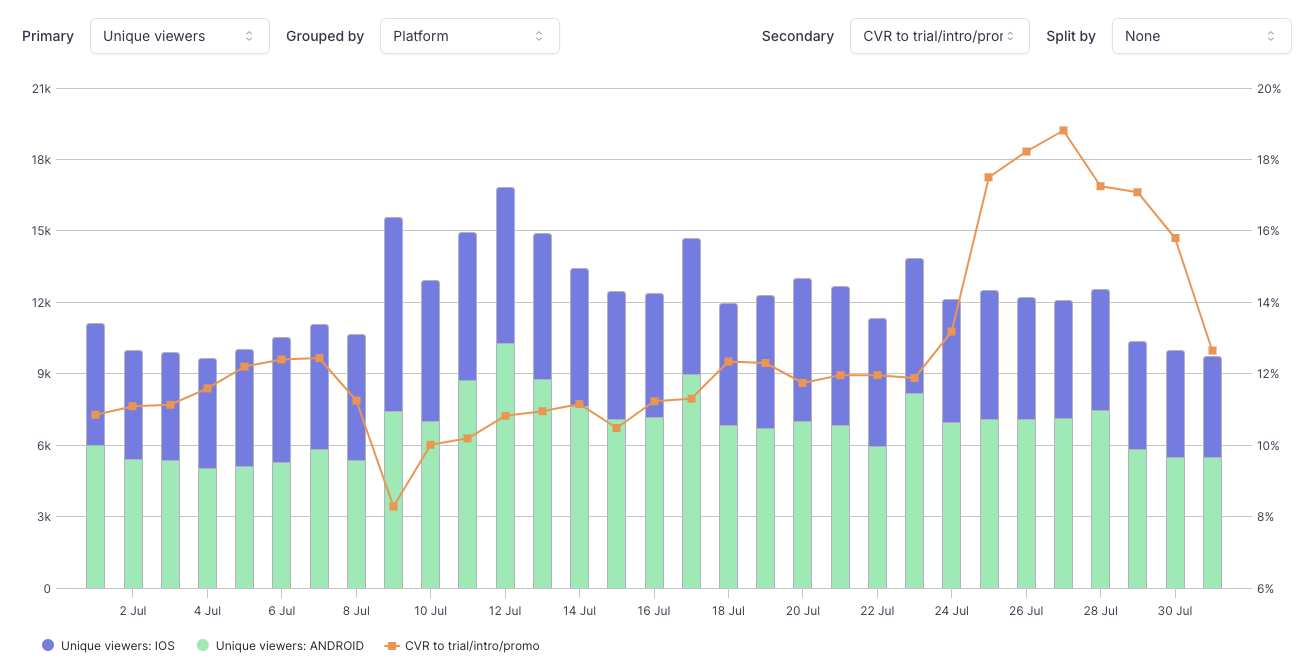
Example of Unique viewers grouped by Platform
Grouping the Primary metrics by a specific dimension allows you to visualize the share of each group. The top 10 groups are displayed in different colors and stacked together in the same bar.
Secondary metrics
The secondary metric is related to Conversion. Conversion can be visualized as an absolute value or as a rate.
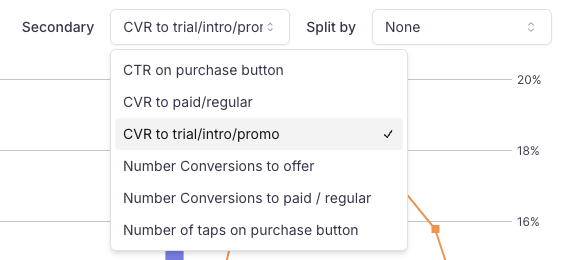
The Secondary metrics corresponds to the units on the right axis.
It is computed by cohort: a conversion is attached back to the period (day / week / month depending on the periodicity defined in the filters) where the Paywall was last displayed to the user, not to the date to which the Conversion actually occurred.
E.g.:
- a user views a Paywall on January 1st
- they click on the Purchase Button
- and start a 1 week free trial
- the free trial converts on January 8th
=> All the conversion metrics above will be attached to the cohort of January 1st because this is the time where the user lifecycle actually started.
Drop of the Conversion Rate to the Regular Offer for recent datesIf your subscriptions start with an Introductory Offer, this means that for recent dates, the drop in Conversion rate to the Regular Offer is only due to the fact that some Users are still benefitting from their Introductory Offer and haven't reach the time where the Conversion to the Regular Offer actually happens. Nothing to worry about :)
The value for Conversion Rates is computed by Uniques viewers.
Click Through Rate on Purchase Button / Taps on Purchase Button leverage the UI / SDK Event PLAN_TAPPED.
Conversion Rate to Introductory or Promotional Offers / Conversions to Introductory or Promotional Offersleverage Offer Events:
# CONVERSIONS = # INTRO_OFFER_STARTED + # TRIAL_STARTED + # PROMOTIONAL_OFFER_STARTED
Conversion Rate to Regular Offer / Conversions to Regular Offer leverage Offer Events and Lifecycle Event:
# CONVERSIONS = # SUBSCRIPTION_STARTED + # INTRO_OFFER_CONVERTED + # TRIAL_CONVERTED + # PROMOTIONAL_OFFER_CONVERTED
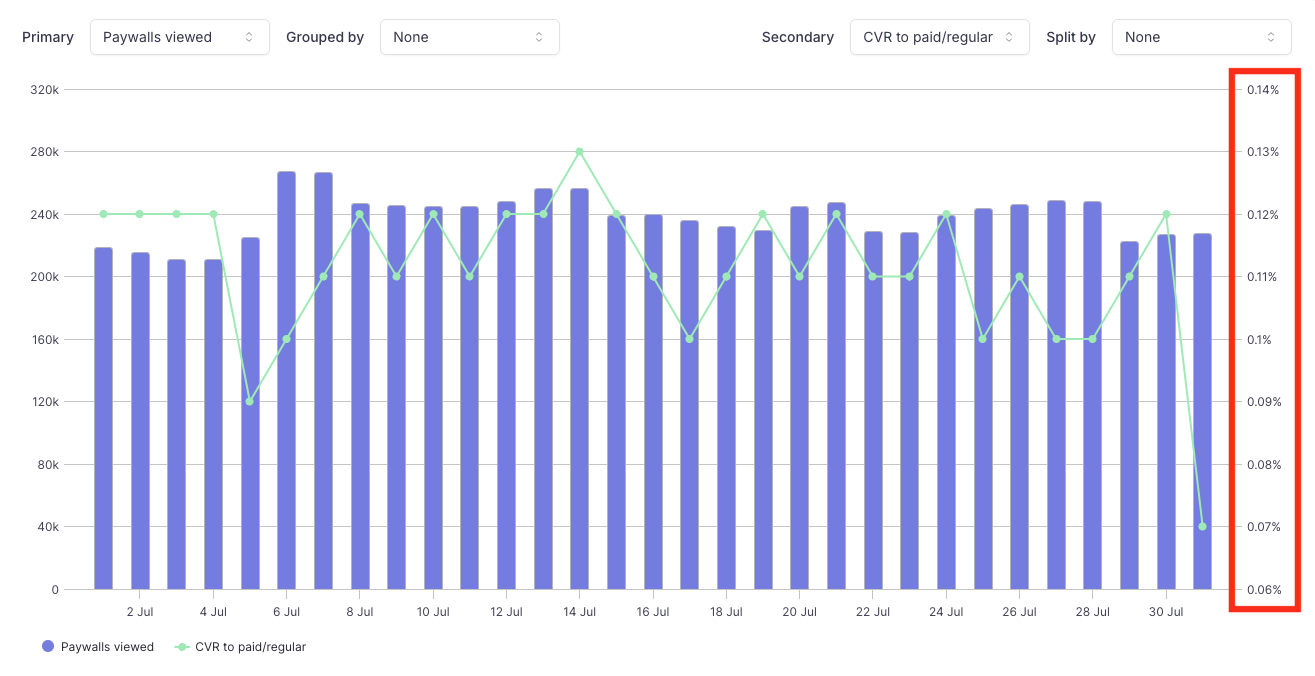
The secondary metric can be split by different dimensions: Audience / Country / Paywall / Placement / Plan / Platform.
Example of conversions split by Plan
Splitting the Secondary metrics by a specific dimension allows you to visualize up to top 10 different series, each representing a different category of the select dimension. Only the 10 top categories are represented.
Table & export
The table beneath the chart contains the raw and aggregated data for the Primary and Secondary metrics.
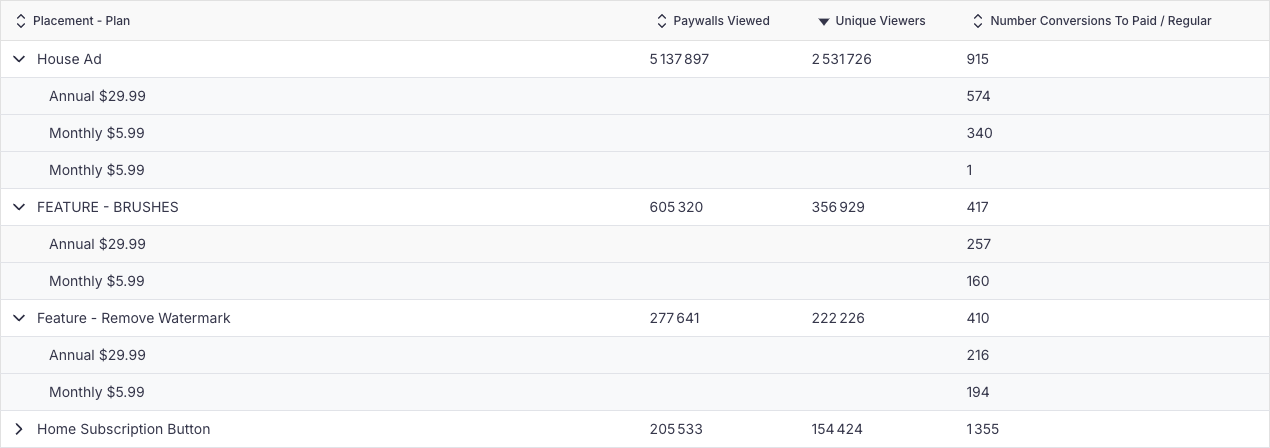
When the Secondary metrics is split by a specific dimension, you can expand each line to get the conversion details for each category by clicking on the right arrow >
To download the full data in CSV, you can click on the Download CSV button

The CSV will be generated server side and you will receive an email with 2 links to download the export when it's ready:
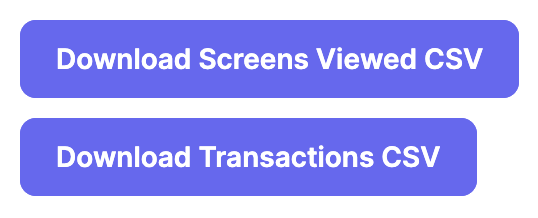
- The first CSV file contains the data about the Screens viewed
- The second CSV file contains the data about the Transactions
Updated 4 months ago
Want to dig deeper in how to use this dashboard to optimize your conversion? Click below 👇