

Purchasely SDK — Debug Mode
Preview, test, and validate in-app experiences directly inside your app before rolling them out to users.
Purchasely Debug Mode allows you to preview the In-App Experiences crafted in the Console exactly as users will see them — on a real device, in multiple languages, with different themes, and under different eligibility conditions. It lets you validate your Screens and Flows safely, without exposing them to your real users.
✨ What Debug Mode Enables
With Debug Mode activated on a device, you can:
- Preview any In-App Experience created in the Purchasely Console (Paywalls, Screens, Flows…): the draft version is visible
- Simulate how an In-App Experience integrates with any Placement - by targeting the
Internal TestersAudience and giving it the highest priority - before making it visible to real users.
Debug Mode only affects the device on which it is activated.
It has zero impact on your production Audiences or Paywall exposure.
Enabling Debug Mode
-
Open the preview QR code of any Screen the Purchasely Console
When editing a Screen, the Console shows a Preview QR Code.
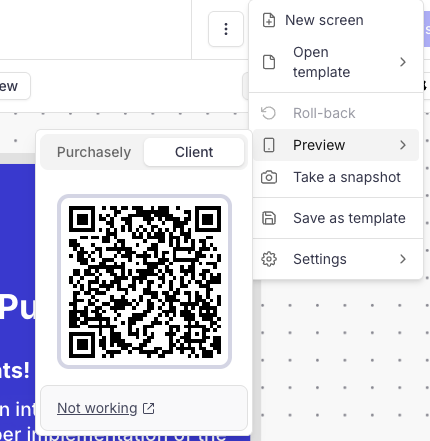
This QR code contains all the metadata needed for your device to load the preview.
Deeplink management requiredTo make the Preview work, you must have implemented Deeplinks management.
-
Scan the QR code with your test device
Open your camera on the device that runs your app with the Purchasely SDK integrated.
After scanning:
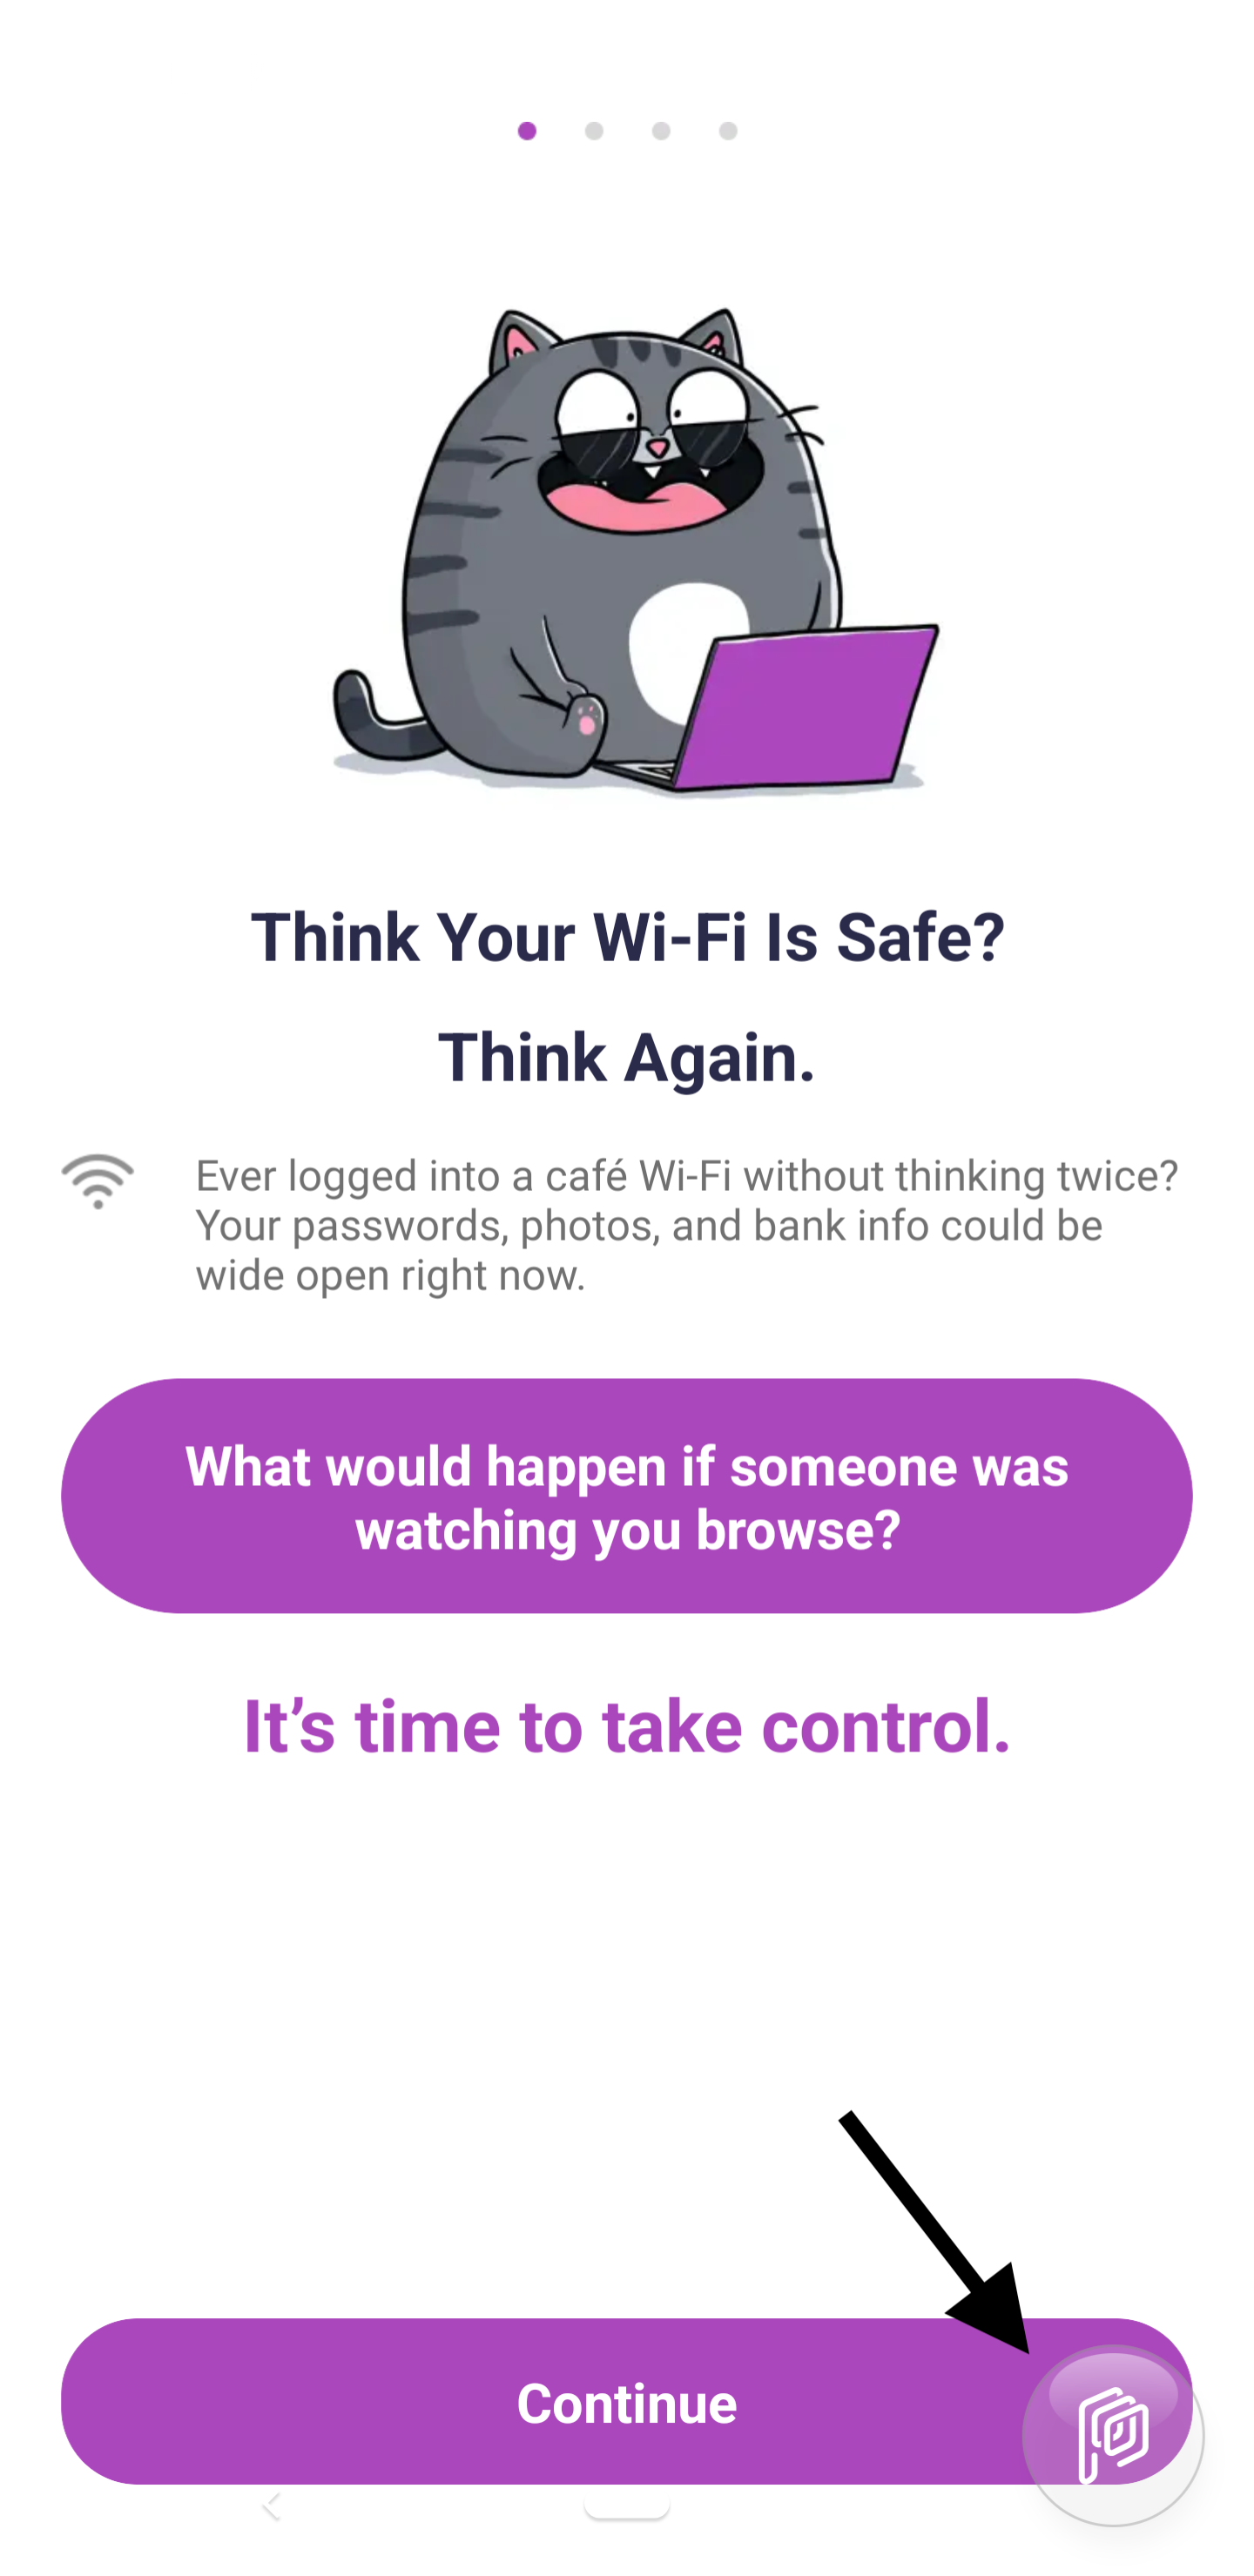
- Your device will open the app and prompt the Purchasely SDK to display the Screen
- A Purchasely Floating Debug Button appears on top of your app UI in the bottom right corner.
-
Open the Floating Debug Button
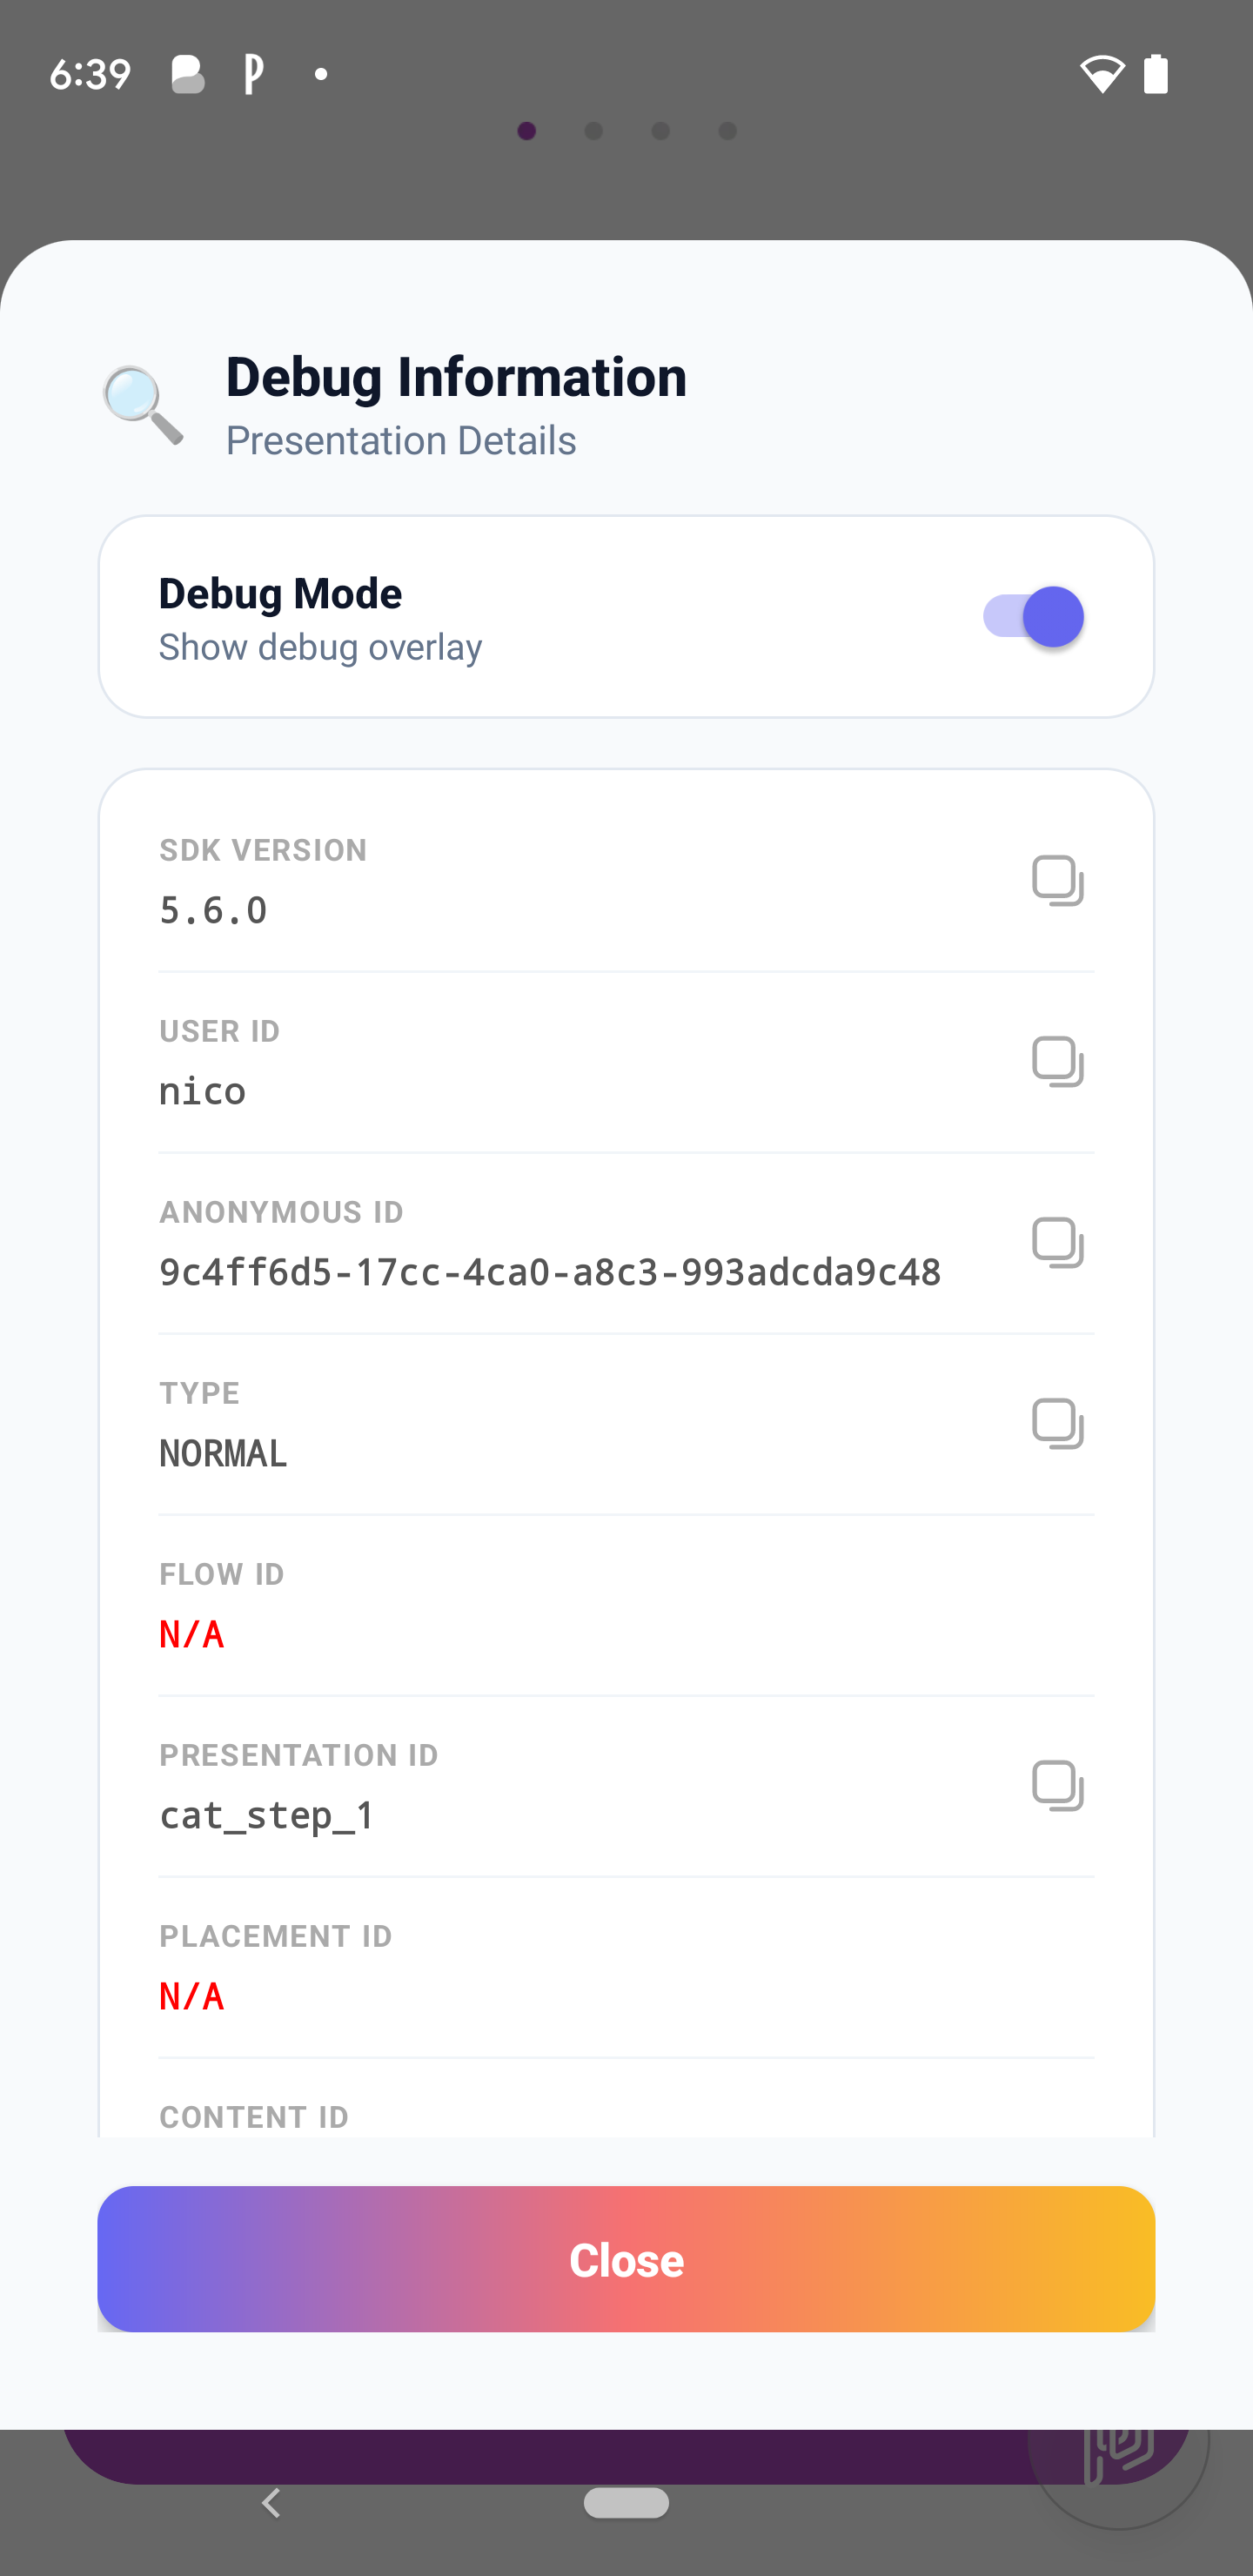
Tap the floating button to open the Debug Panel.
The Debug Panel shows contextual information about:
- The SDK version installed on the device
- User ID and User Anonymous ID
- Current Screen information and associated meta data (Placement, Flow, Campaign, Audience, A/B test, A/B test variant etc...)
-
Activate Debug Mode
From the Debug Panel, you can Enable Debug Mode by activating the switch.
Once activated:
- Your device enters the Internal Testers audience (Built-in User attribute
debug mode=true) - You can now close the Debug Panel and Screen displayed and browse your application
- Your device enters the Internal Testers audience (Built-in User attribute
-
Target In-App Experiences to
Internal TestersIn the Console, you can map an In-App Experience with the Audience
Internal Testersand any Placement.
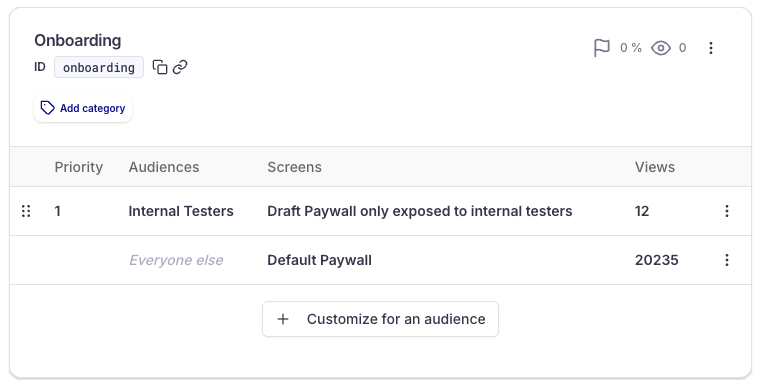
Put that Audience in first position (with the highest priority) to make sure that test devices will not match another condition with a higher priority.
-
Navigate in your app or use the Placement deeplink
When you'll hit a Placement, your device with the debug mode activated will match the Audience
Internal Testersand you will be able to see the corresponding Screen / Paywall (in the draft version).
How Debug Mode Works
The Audience Internal Testers leverages the Built-in User attribute debug mode.
When you activate the Debug Mode by scanning a QR code from the Console, this set the value debug mode = true for this device.
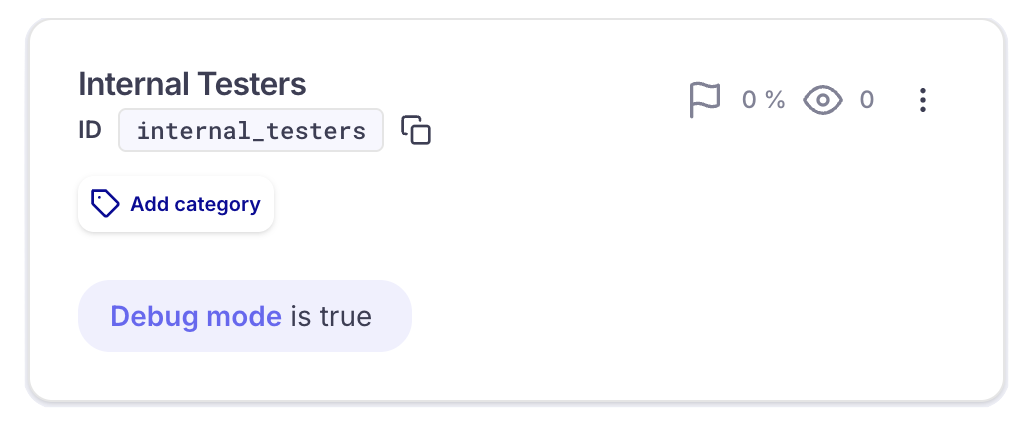
Your real users do not match this Audience and In-App Experiences targeted to the Internal Testers Audience are shown only to devices with the Debug Mode activated.
This Audience can be used as a targeting condition for any:
- Placement
- Campaign
- A/B test
When Debug Mode is deactivated from the Debug Panel, the device is immediately removed from this audience (by setting the Built-in User Attribute debug mode to false)
This makes it safe to test any new experience - even incomplete ones - without risking exposure to actual users.
Updated 7 months ago