
Dashboard - Events
This page provides details on the Events dashboard
The Events dashboard is an experimental tool, to allow you to visualize all the Server Events generated by the Platform.
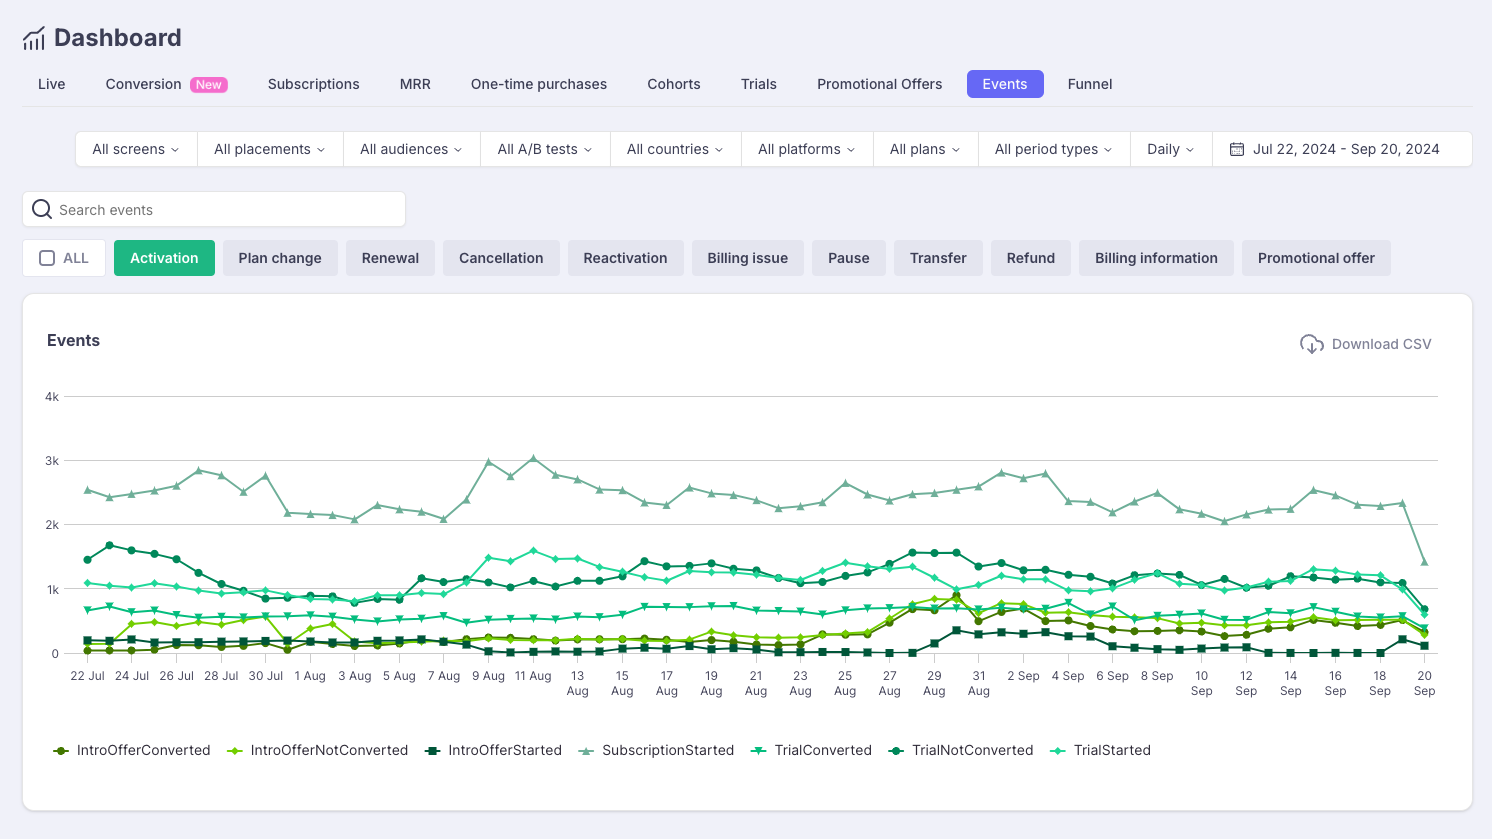
Sample chart to visualize Server Events related to Introductory Offers (started, converted, not converted)
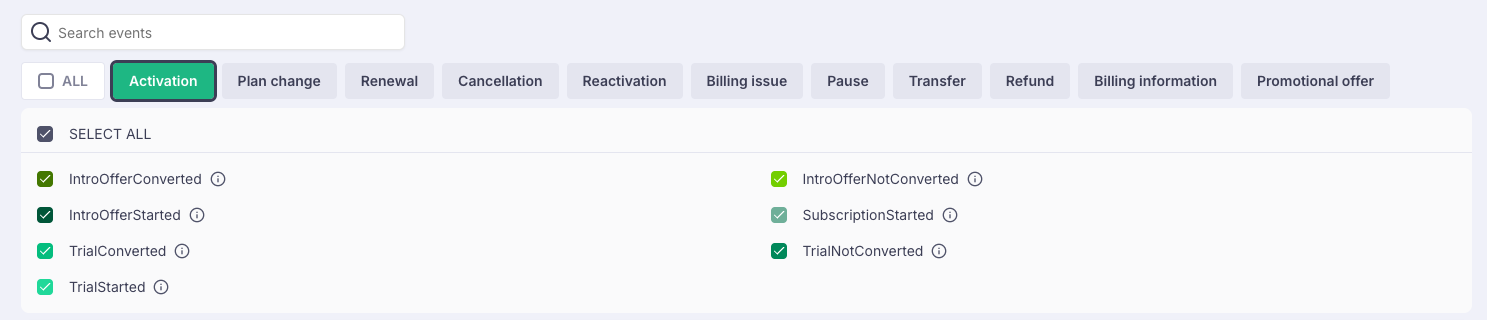
Events are grouped by categories. You can open a category by clicking on it and then select the desired events you want to visualize.
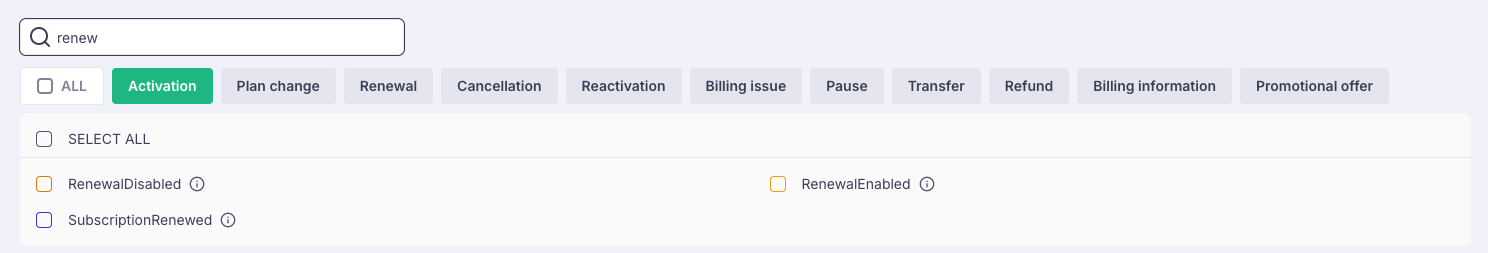
You can also type the name of an event in the search bar.
This tool allows you to identify business opportunities by analyzing the number of occurrences of specific Events in the subscription lifecycle.
For instance, by focusing on Billing issues, you can assess the daily/weekly/monthly volumes of Grace period, and the proportion of times where they are recovered and determine whether it would be worth it or not to create an automation to remind the users to update their billing details to avoid losing their premium benefits while they are in Grace period.
Updated 5 months ago